How to create Dashboards in Zabbix
Introduction
This is going to be a more basic article because what dashboards you want, how many you want, and the types of machines/services you are monitoring vary widely.
In short, this article will familiarize you with how to create dashboards, grab device information, and the importance of classifying devices by catergories or customers for easy dashboard creation.
Getting started
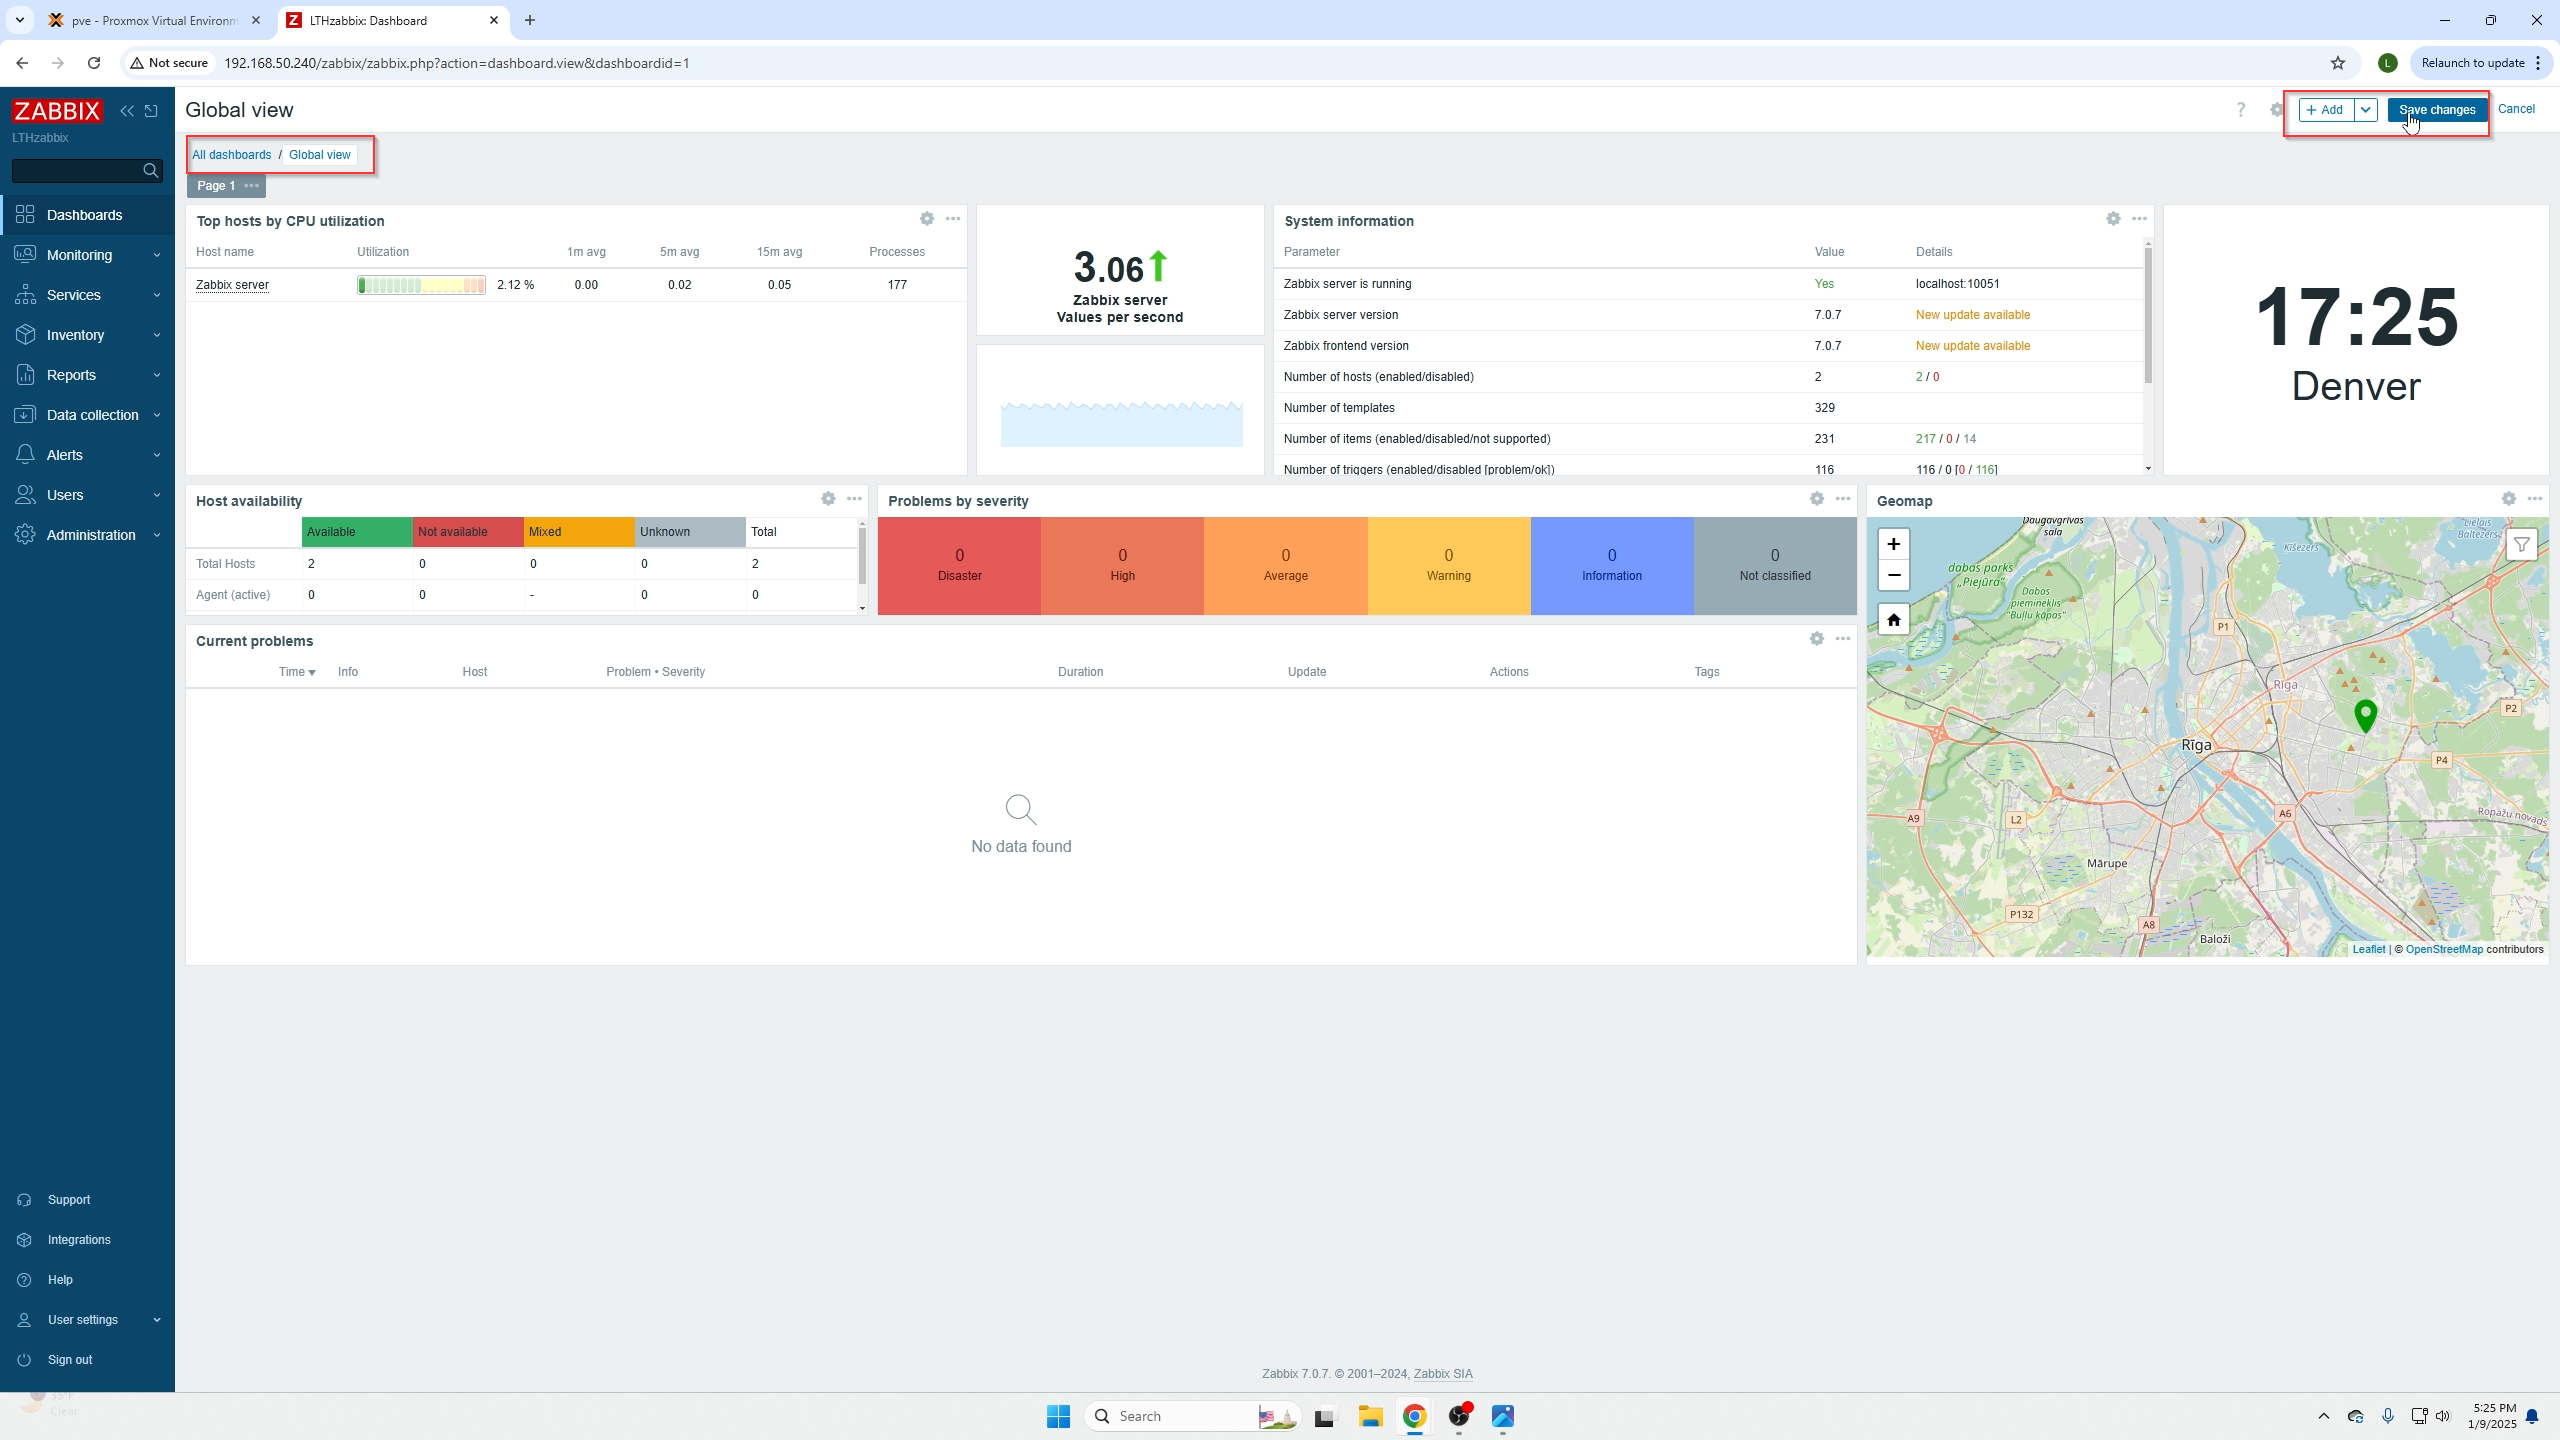
Firs go ahead and login to your Zabbix Dashboard/Monitoring service website. Selecting the Dashboard menu on the far left will present you with the following screen.
You can view all your dashboards by selecting the all dashboards found on the top right of this page. When editing a dashboard you will be able to save on the top right.
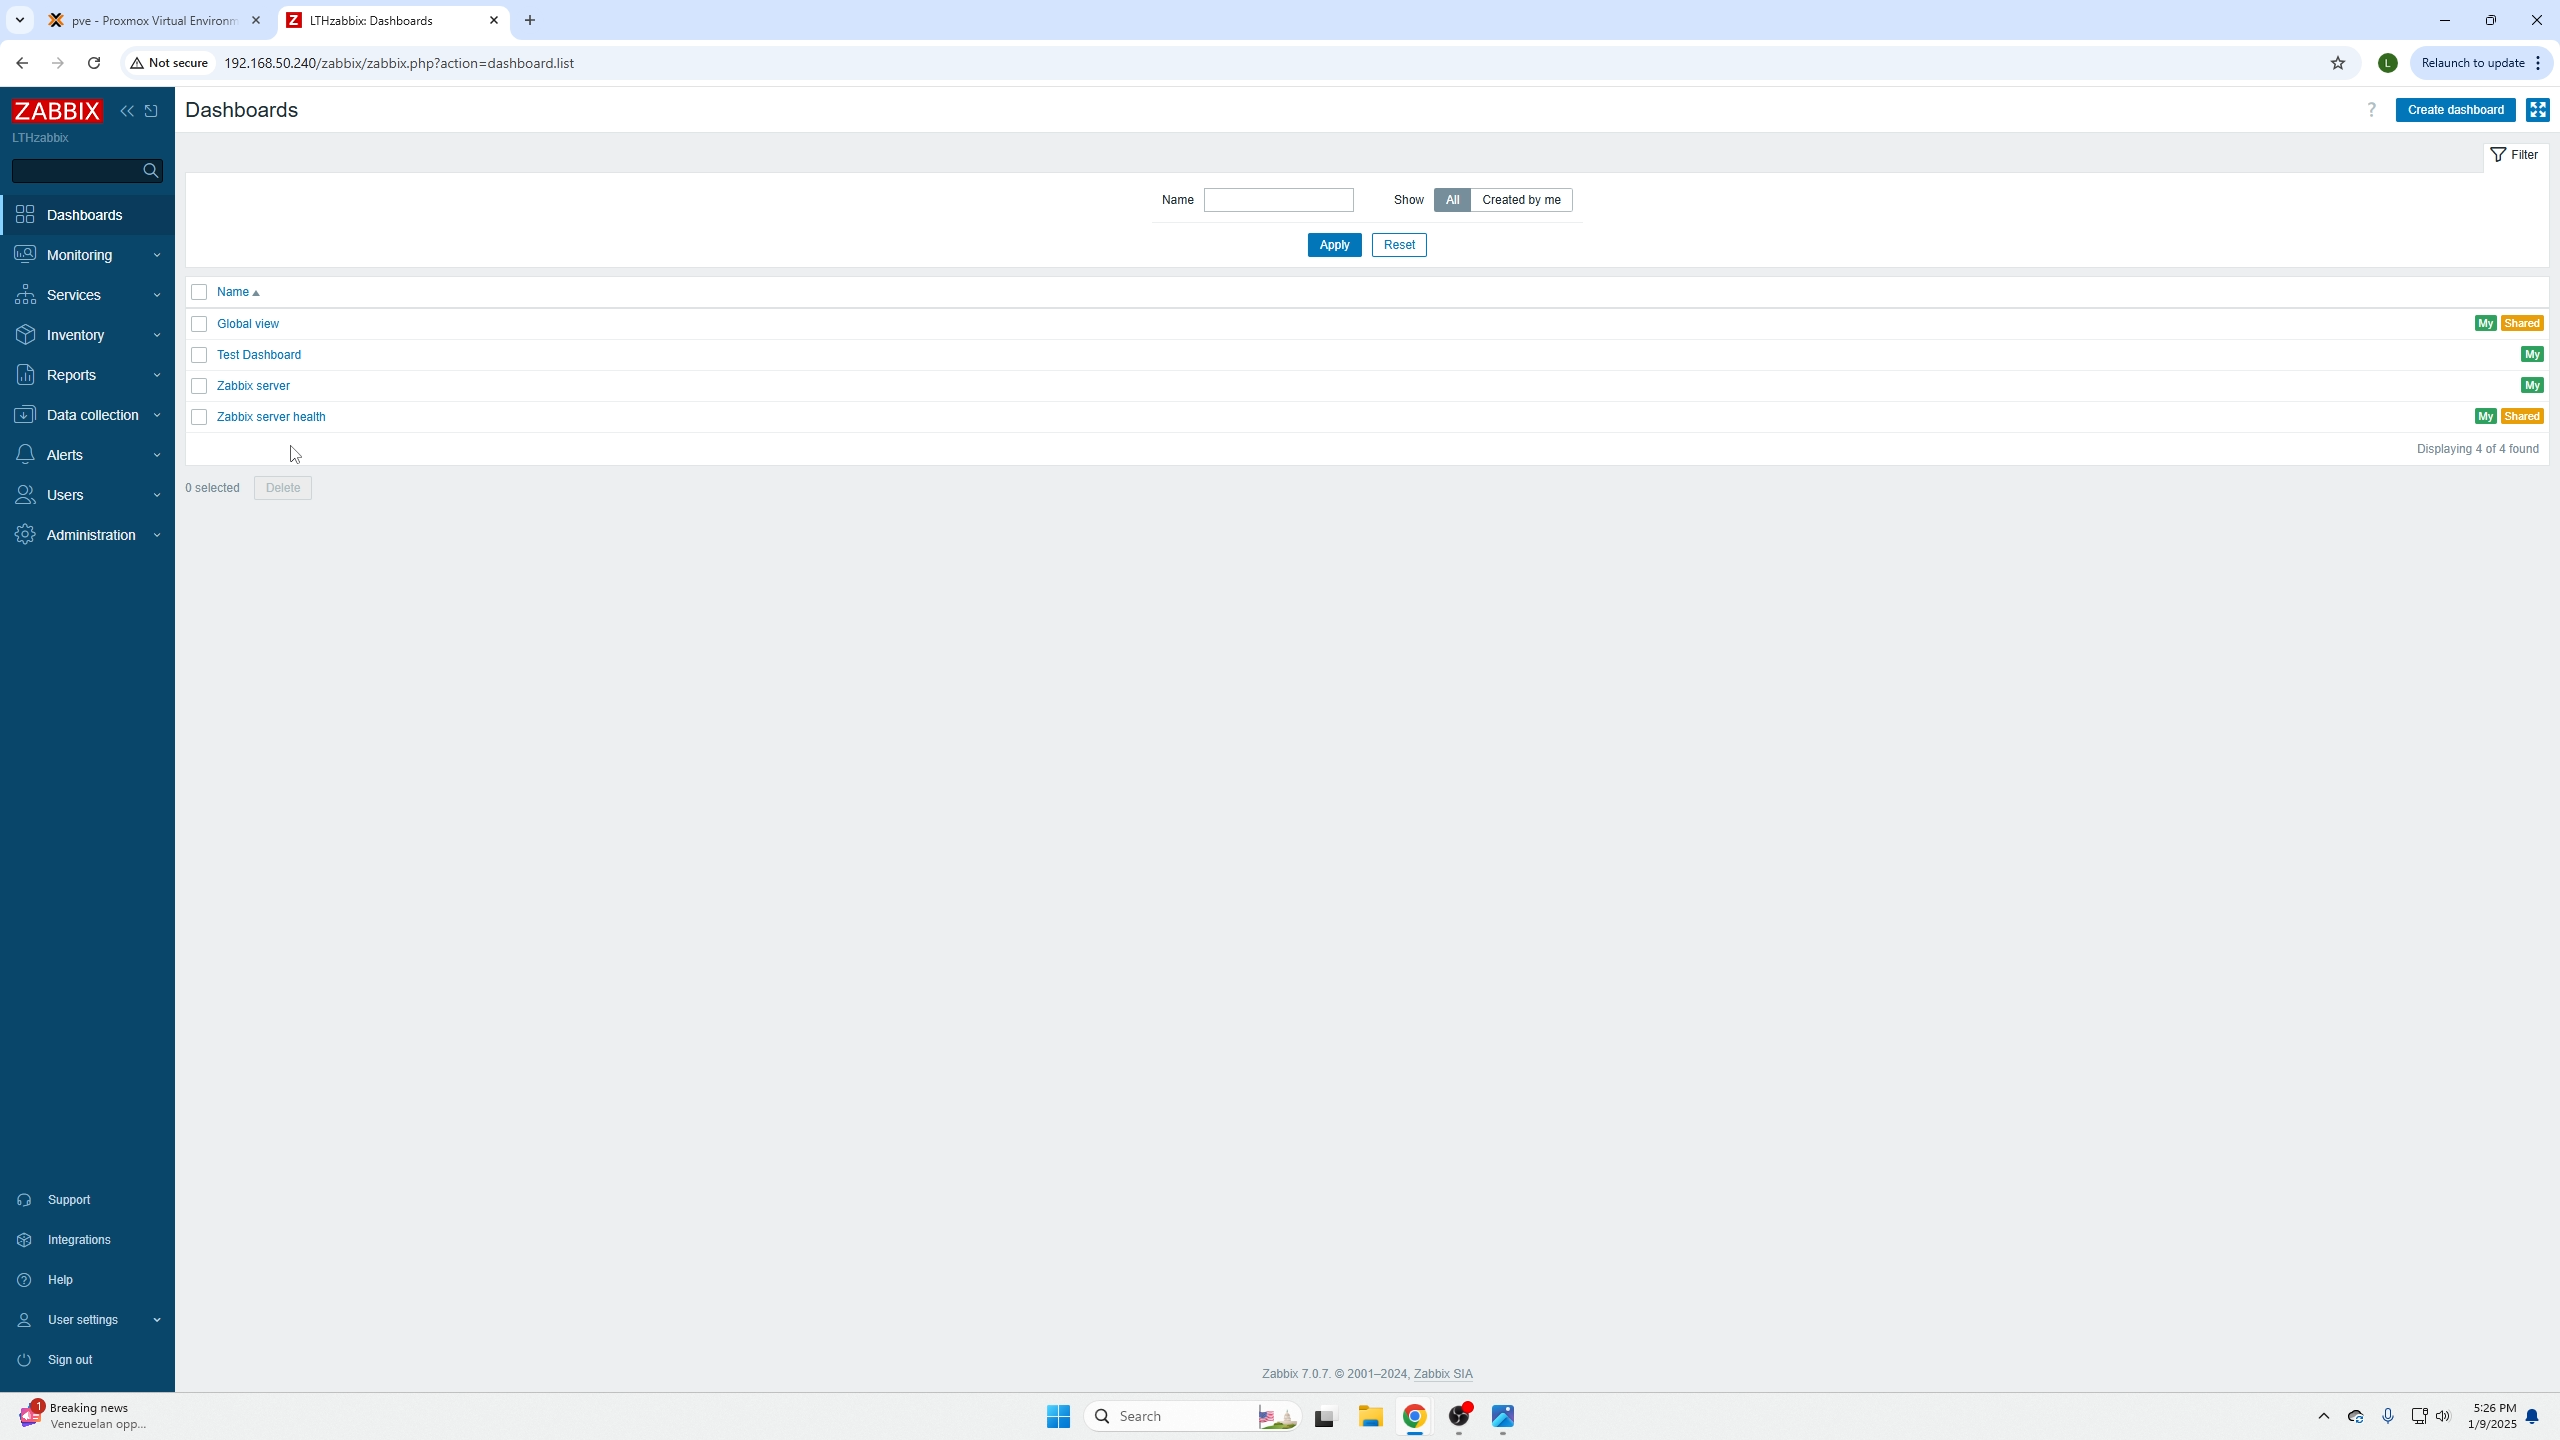
After selecting all dashboards you can see a list of all your dashboards. It is best practice to make dashboards for specific customers, job types (network engineers monitoring all the switches and routers for example) etc. You want to try and avoid have cluttered or overwhelming dashboards.
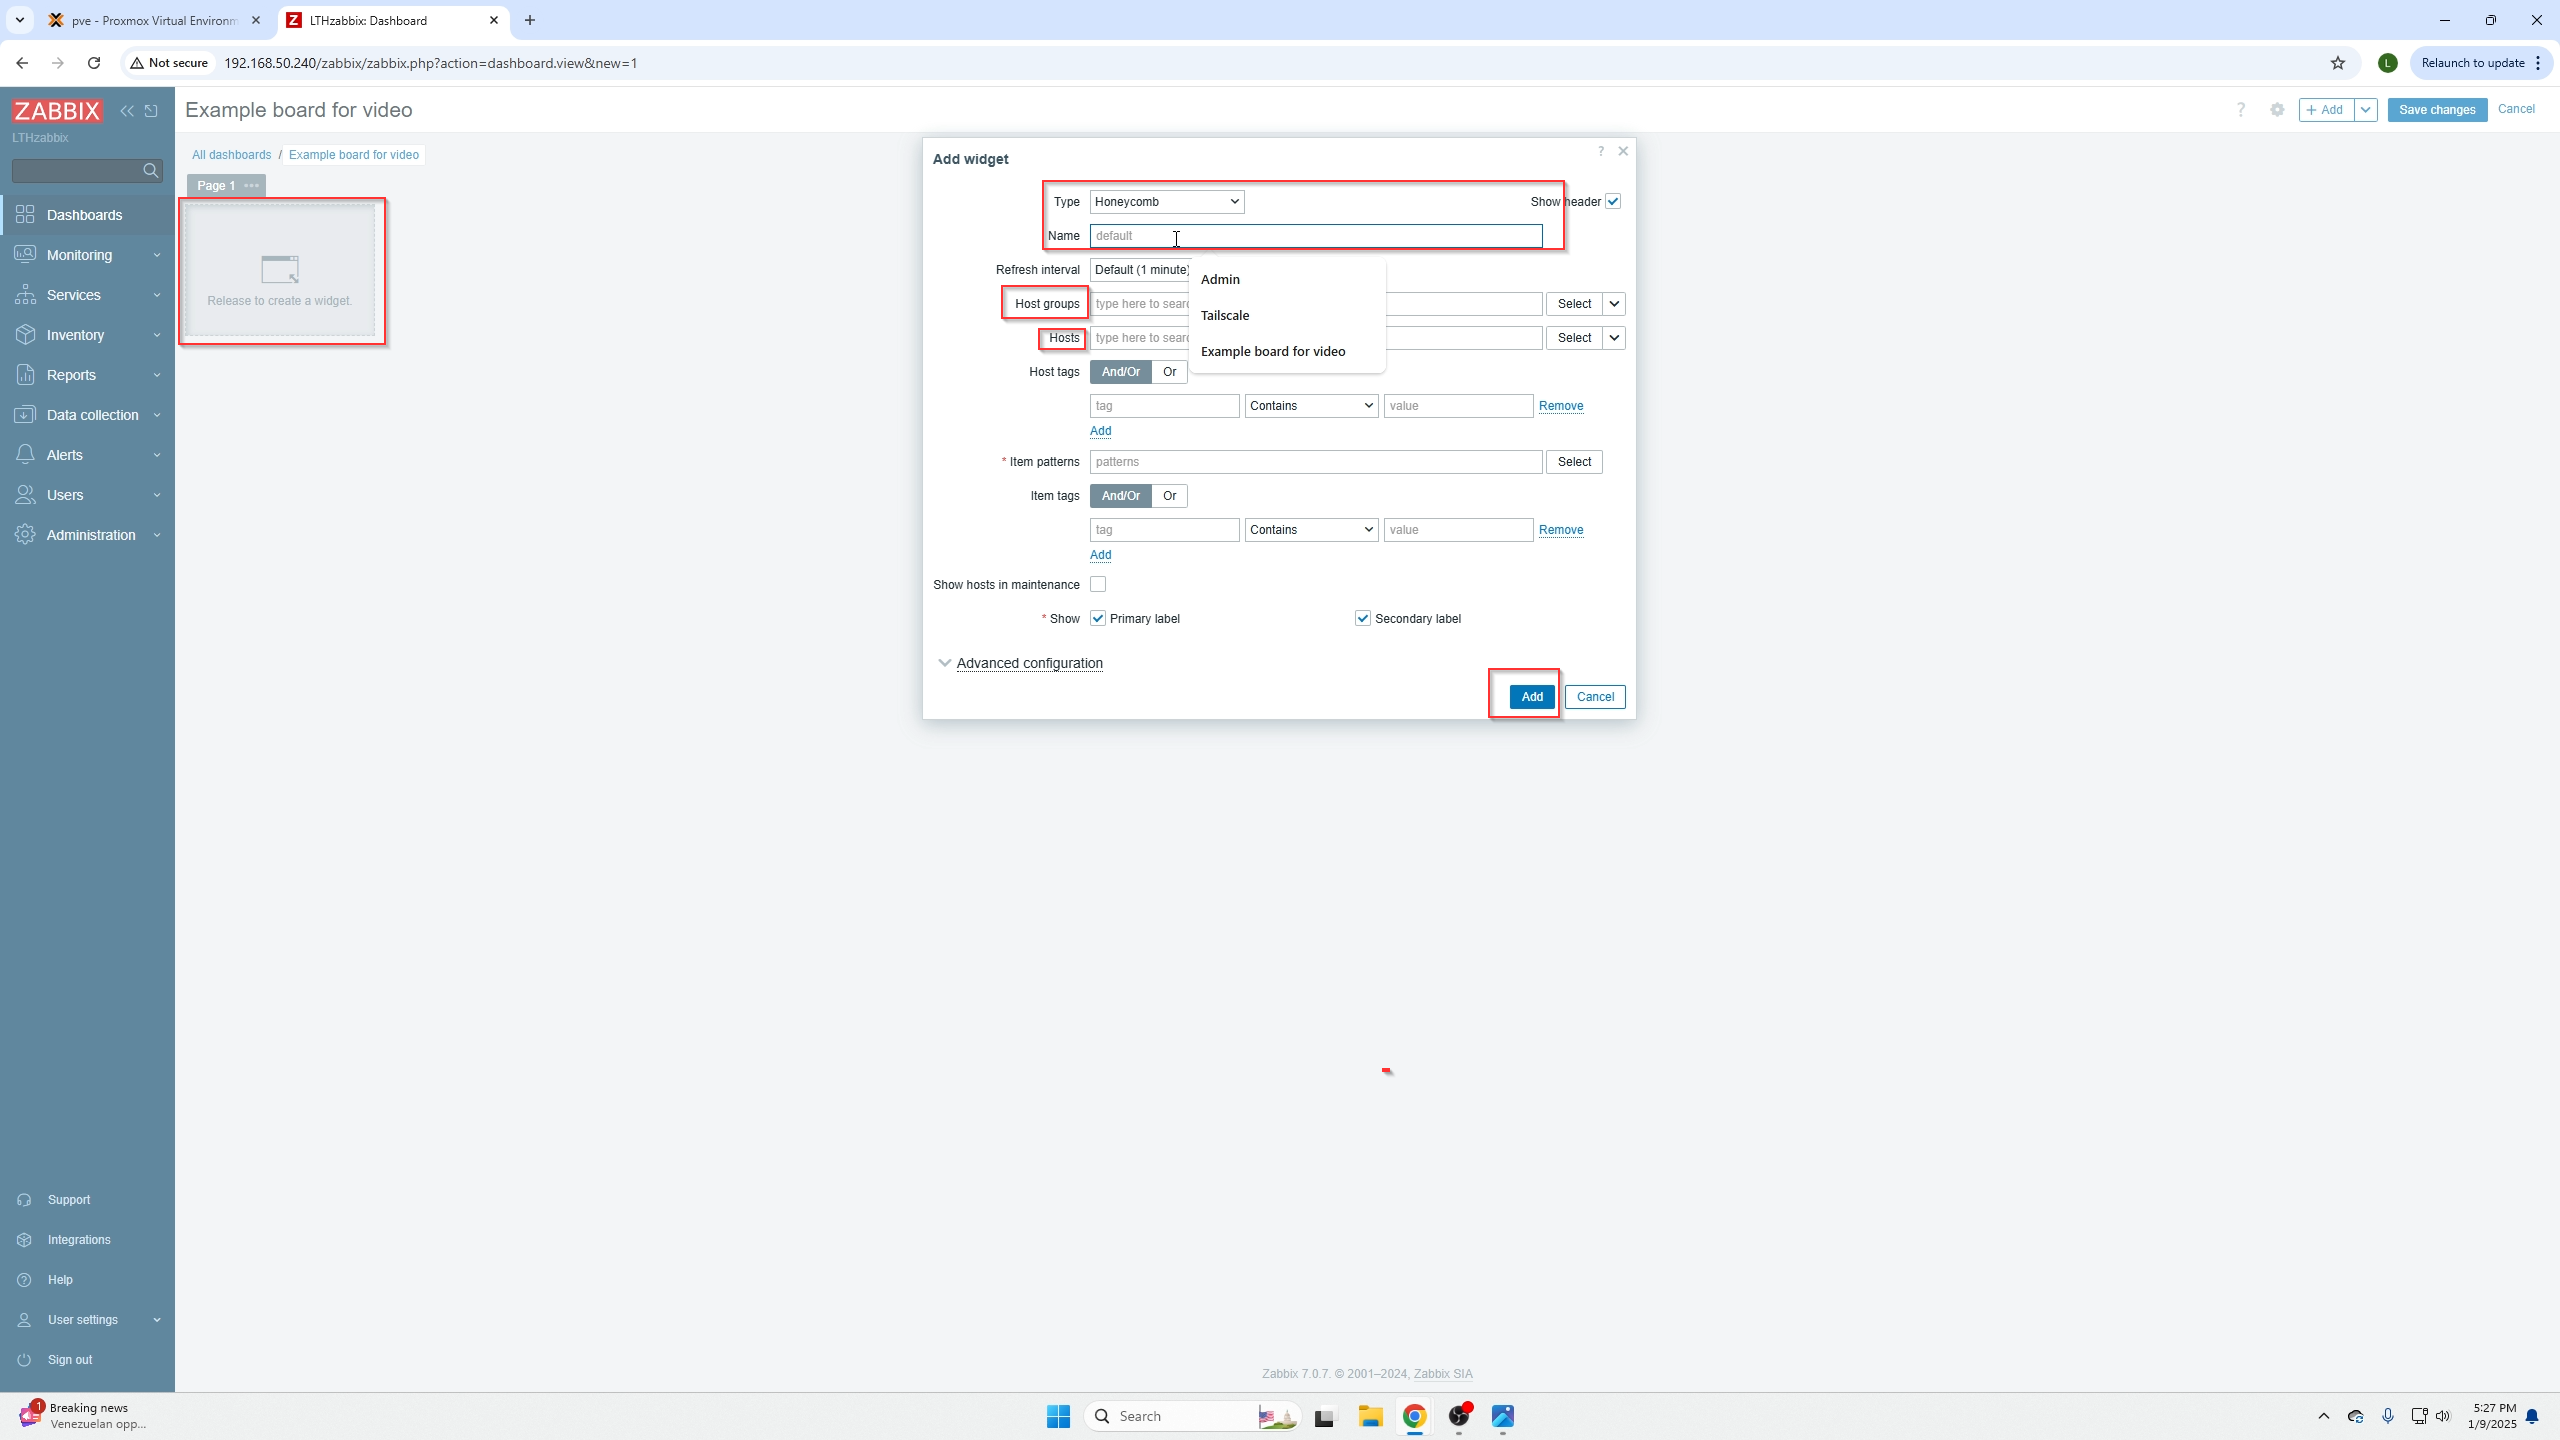
After selecting create a new dashboard on the top right, you can select anywhere in the menu to create a widget and will be presented with the following screen.
The type of dashboard you pick is how the information will be presented, graphs, tables, pictures, etc.
Host groups is a grouping of devices you should have created when adding agents, for example, you should have a group for a specific customer or all your routers/switches. This allows you to pull all their info in quickly.
Hosts are a more refined search where you can select certain devices of a group.
(do not select add just yet)
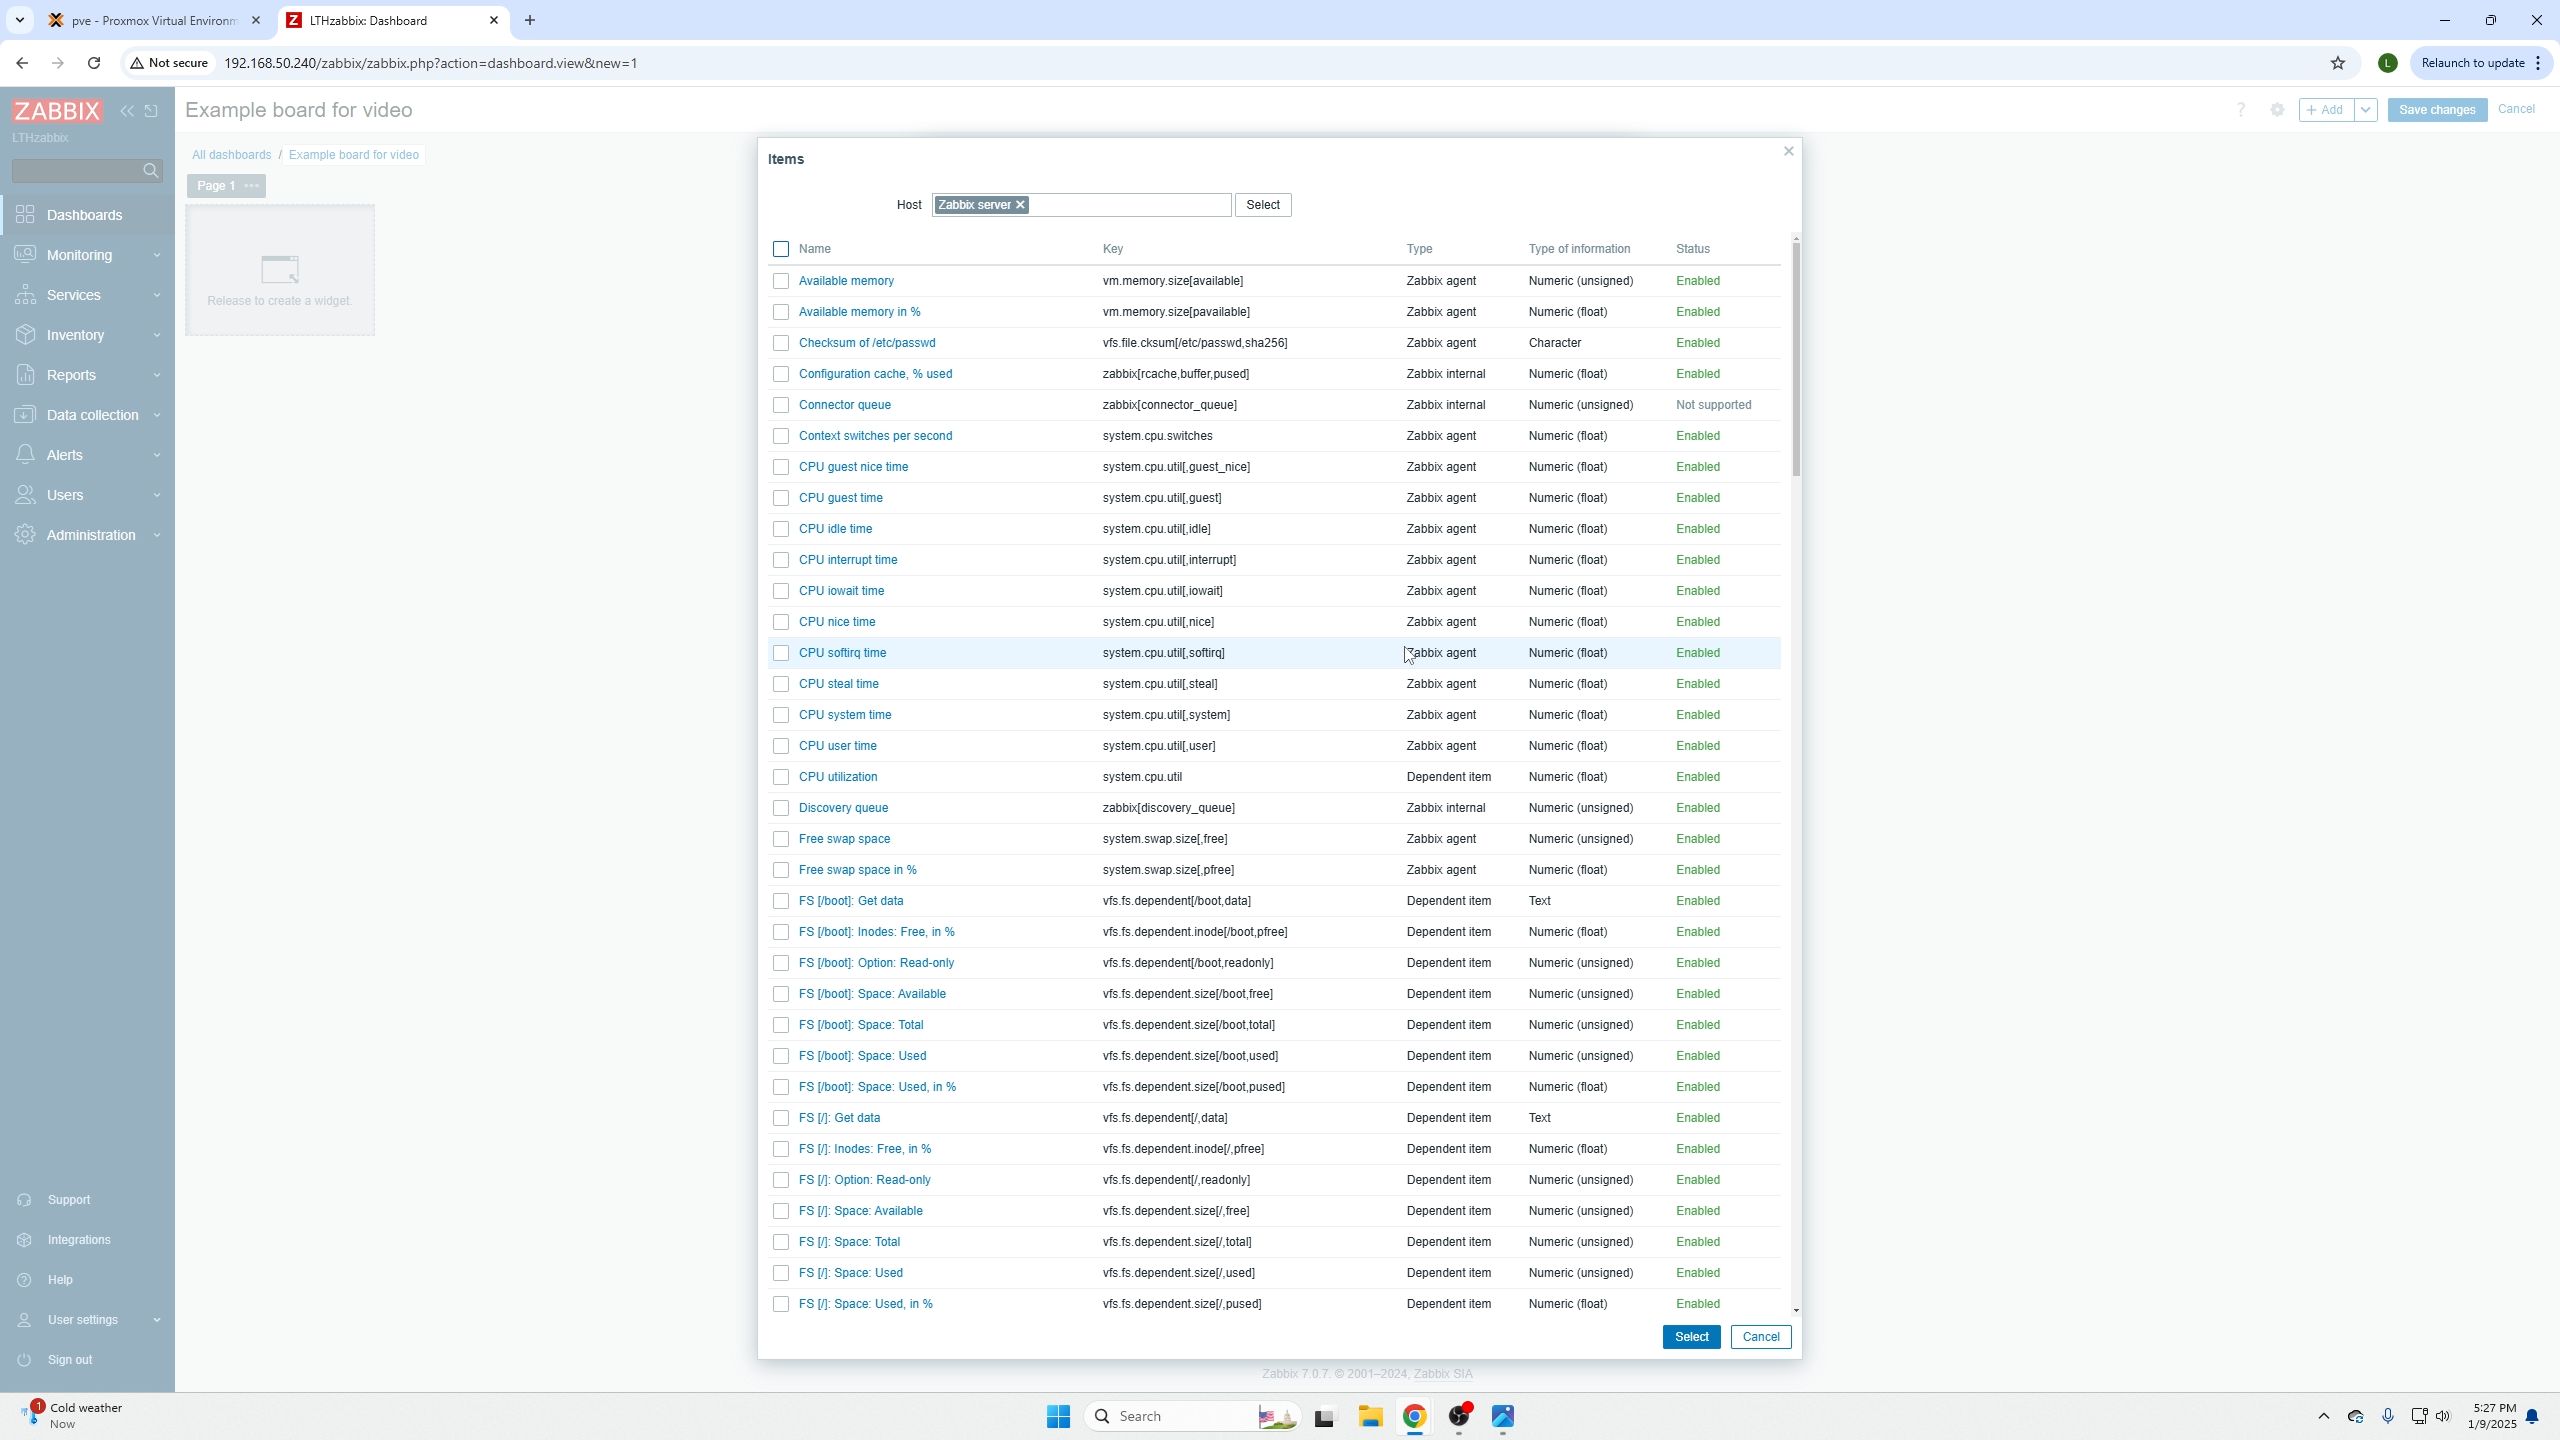
Before selecting add you will be presented with a screenn like below, this screen depends on what type of widget you created but you are provided a list of resources you can choose to monitor. This will take trial and error though. Some selections may not reveal any information because the agent is unable to pull that type of data (it is service dependent).
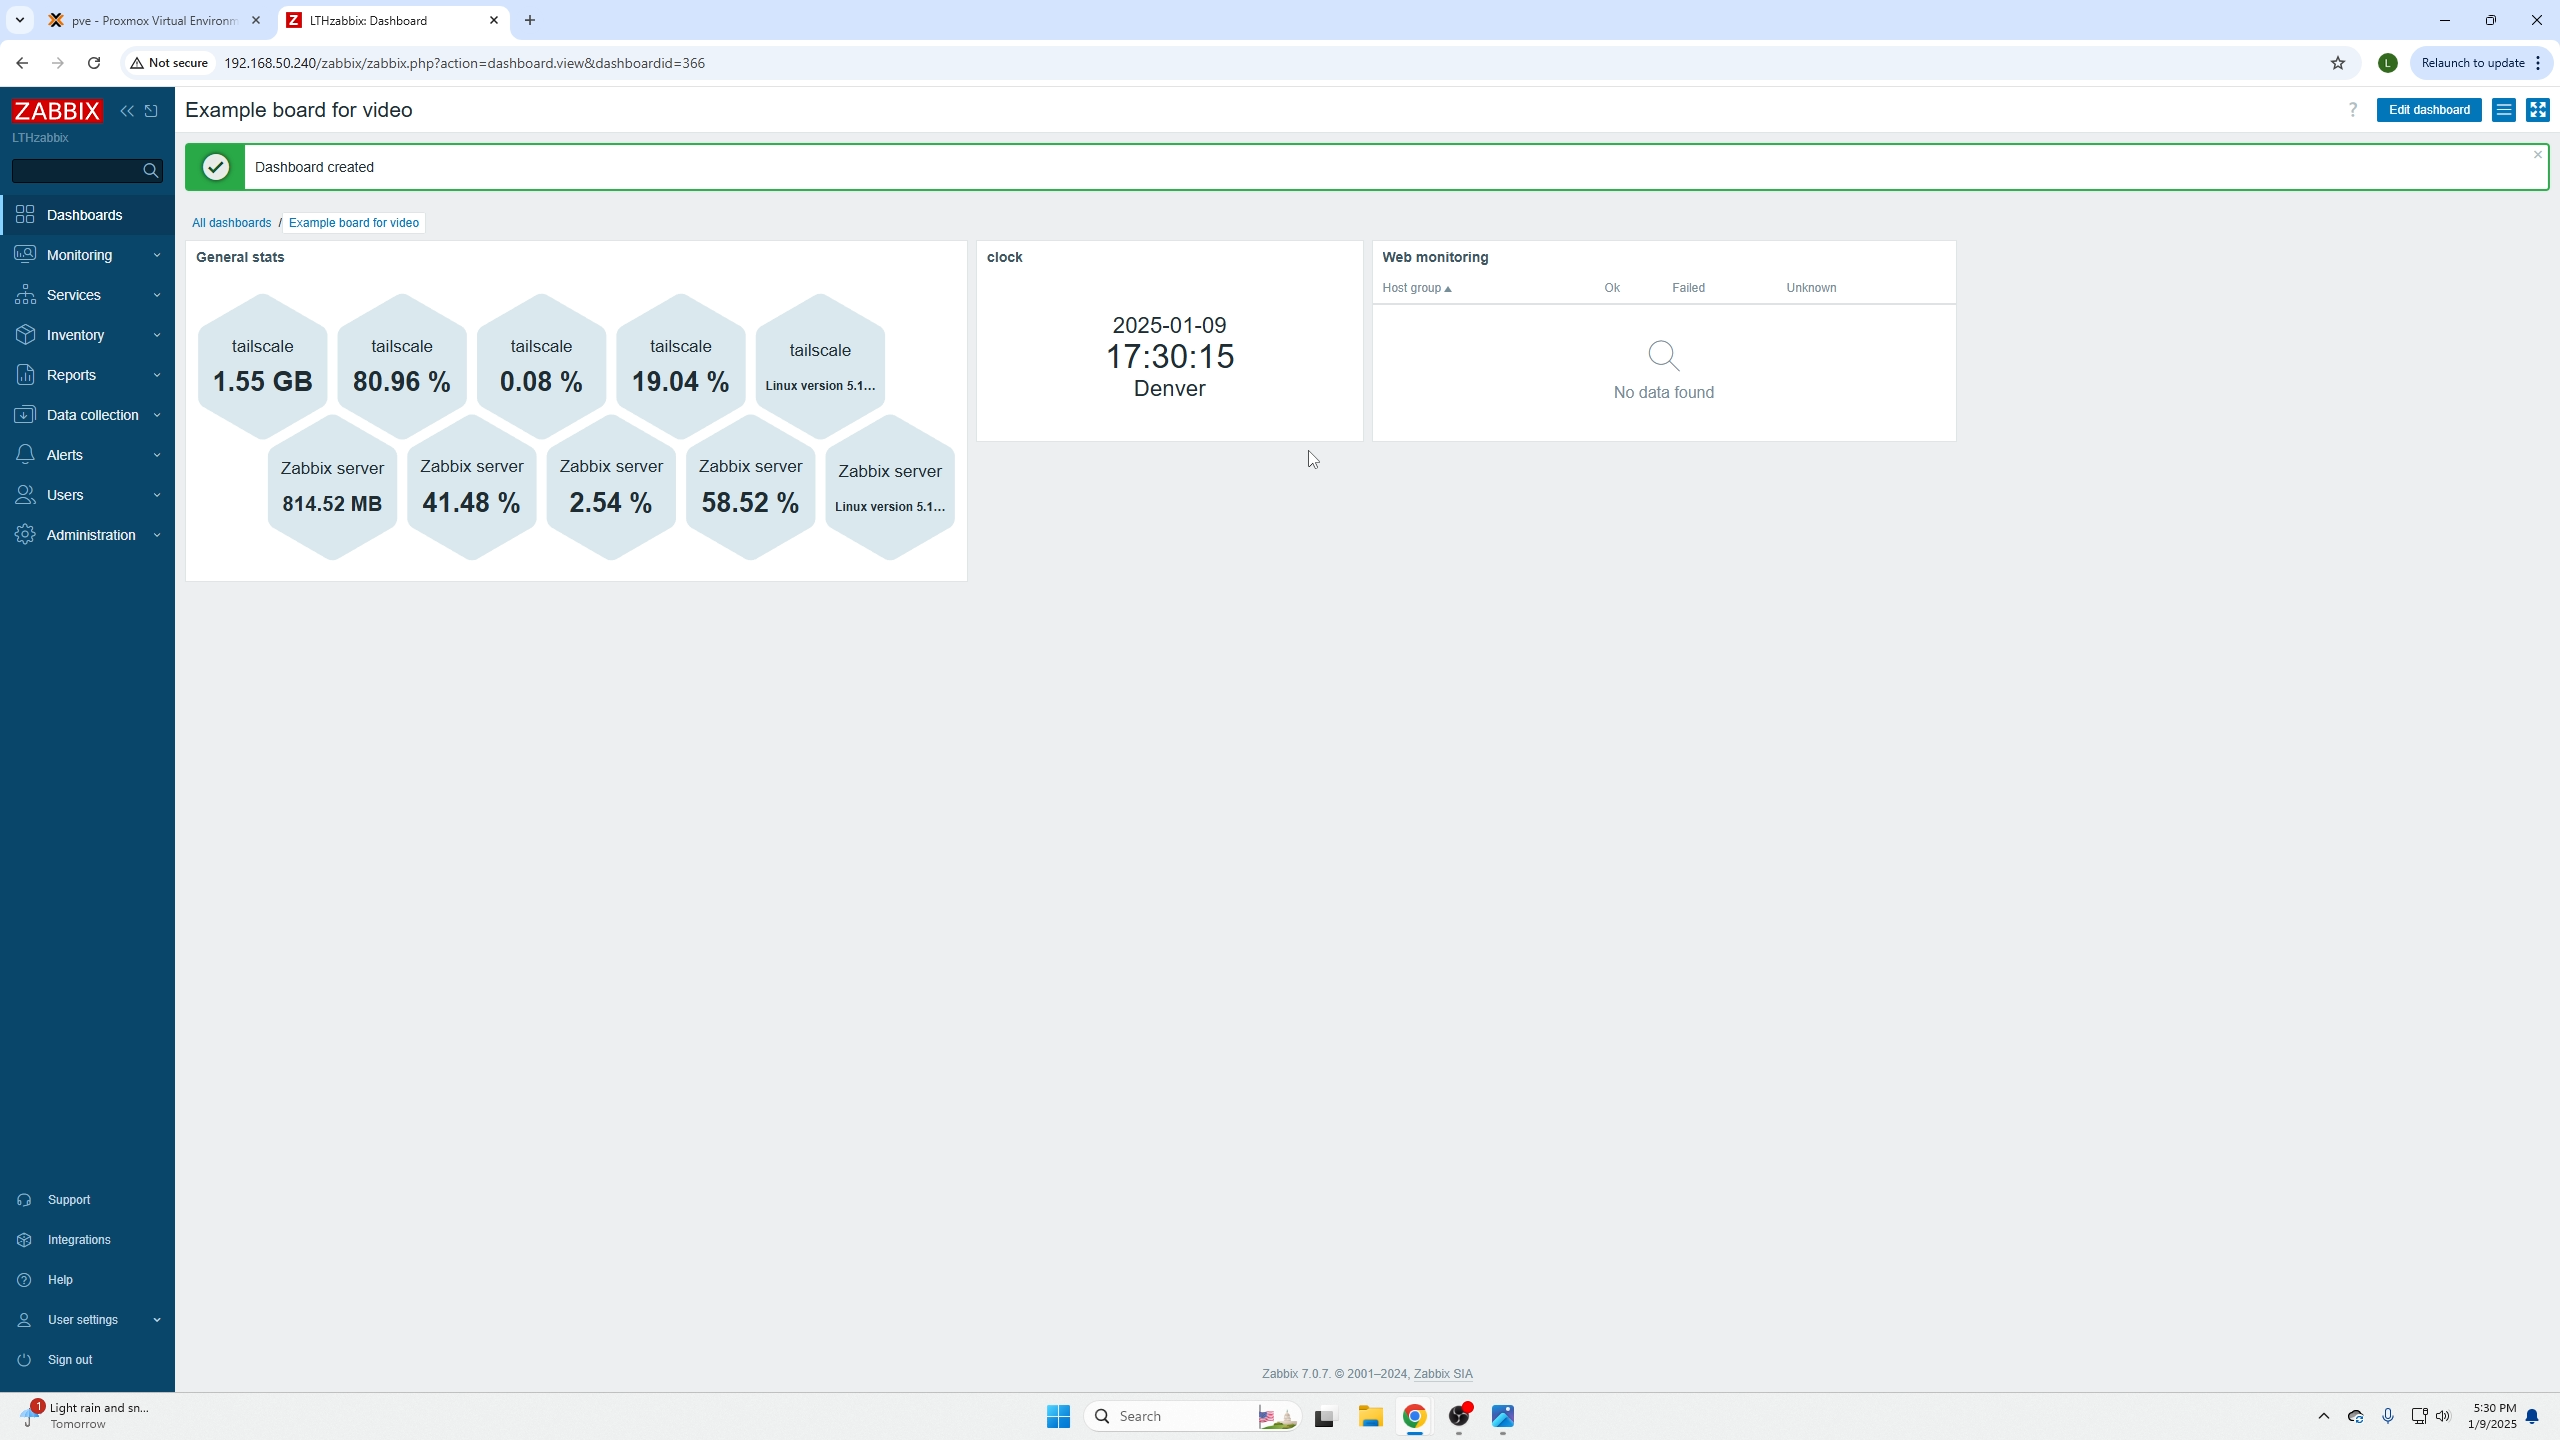
That is it, here is a quick and basic example of what your newly created dashboard could look like. Super simple, super easy to do!
Closing thoughts
Join our discord and share screenshots of your custom made dashboards Discord