How to Install The Wazuh Agent
In this episode we are going to cover the following things on top of installing the Wazuh Agent:
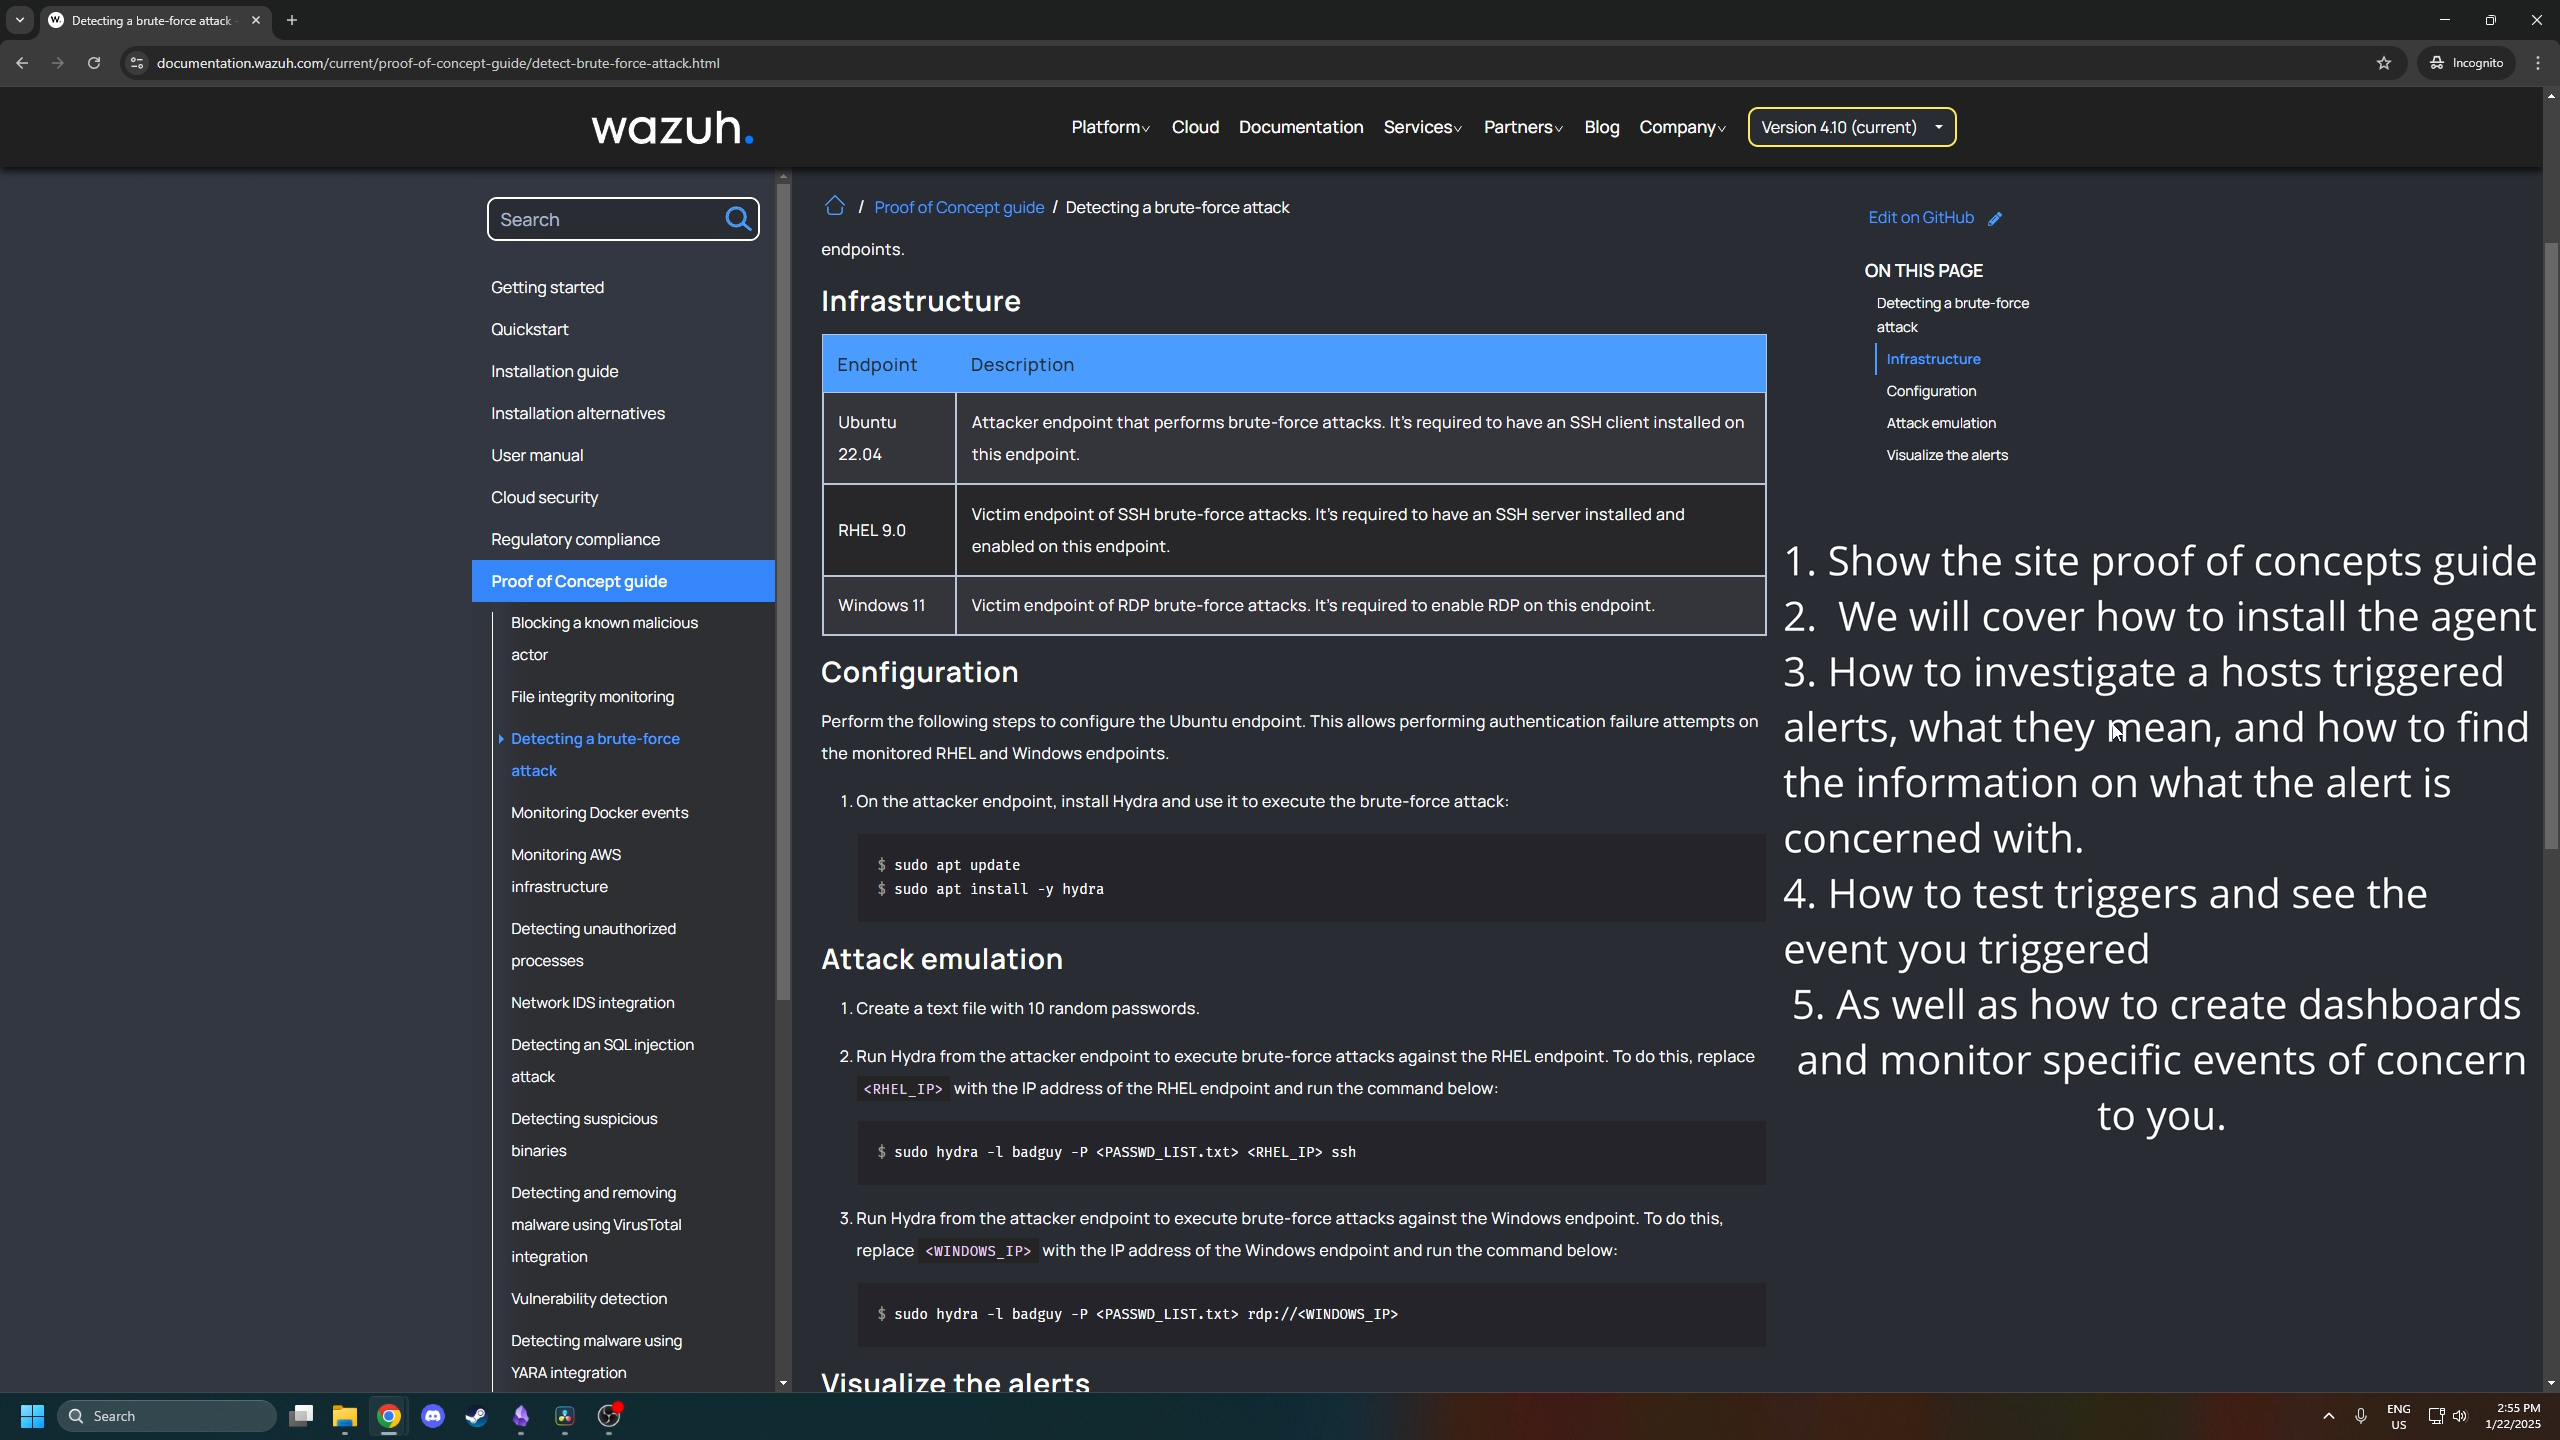
- Show the site proof of concepts guide found here
- We will cover how to install the agent
- How to investigate a hosts triggered alerts, what they mean, and how to find the information on what the alert is concerned with.
- How to test triggers and see the event you triggered
- As well as how to create dashboards and monitor specific events of concern to you.
Here is an example of the concepts guide, simply put it is great info on how to test out your network and ensure Wazuh is doing its job.
Installing the Wazuh Agent
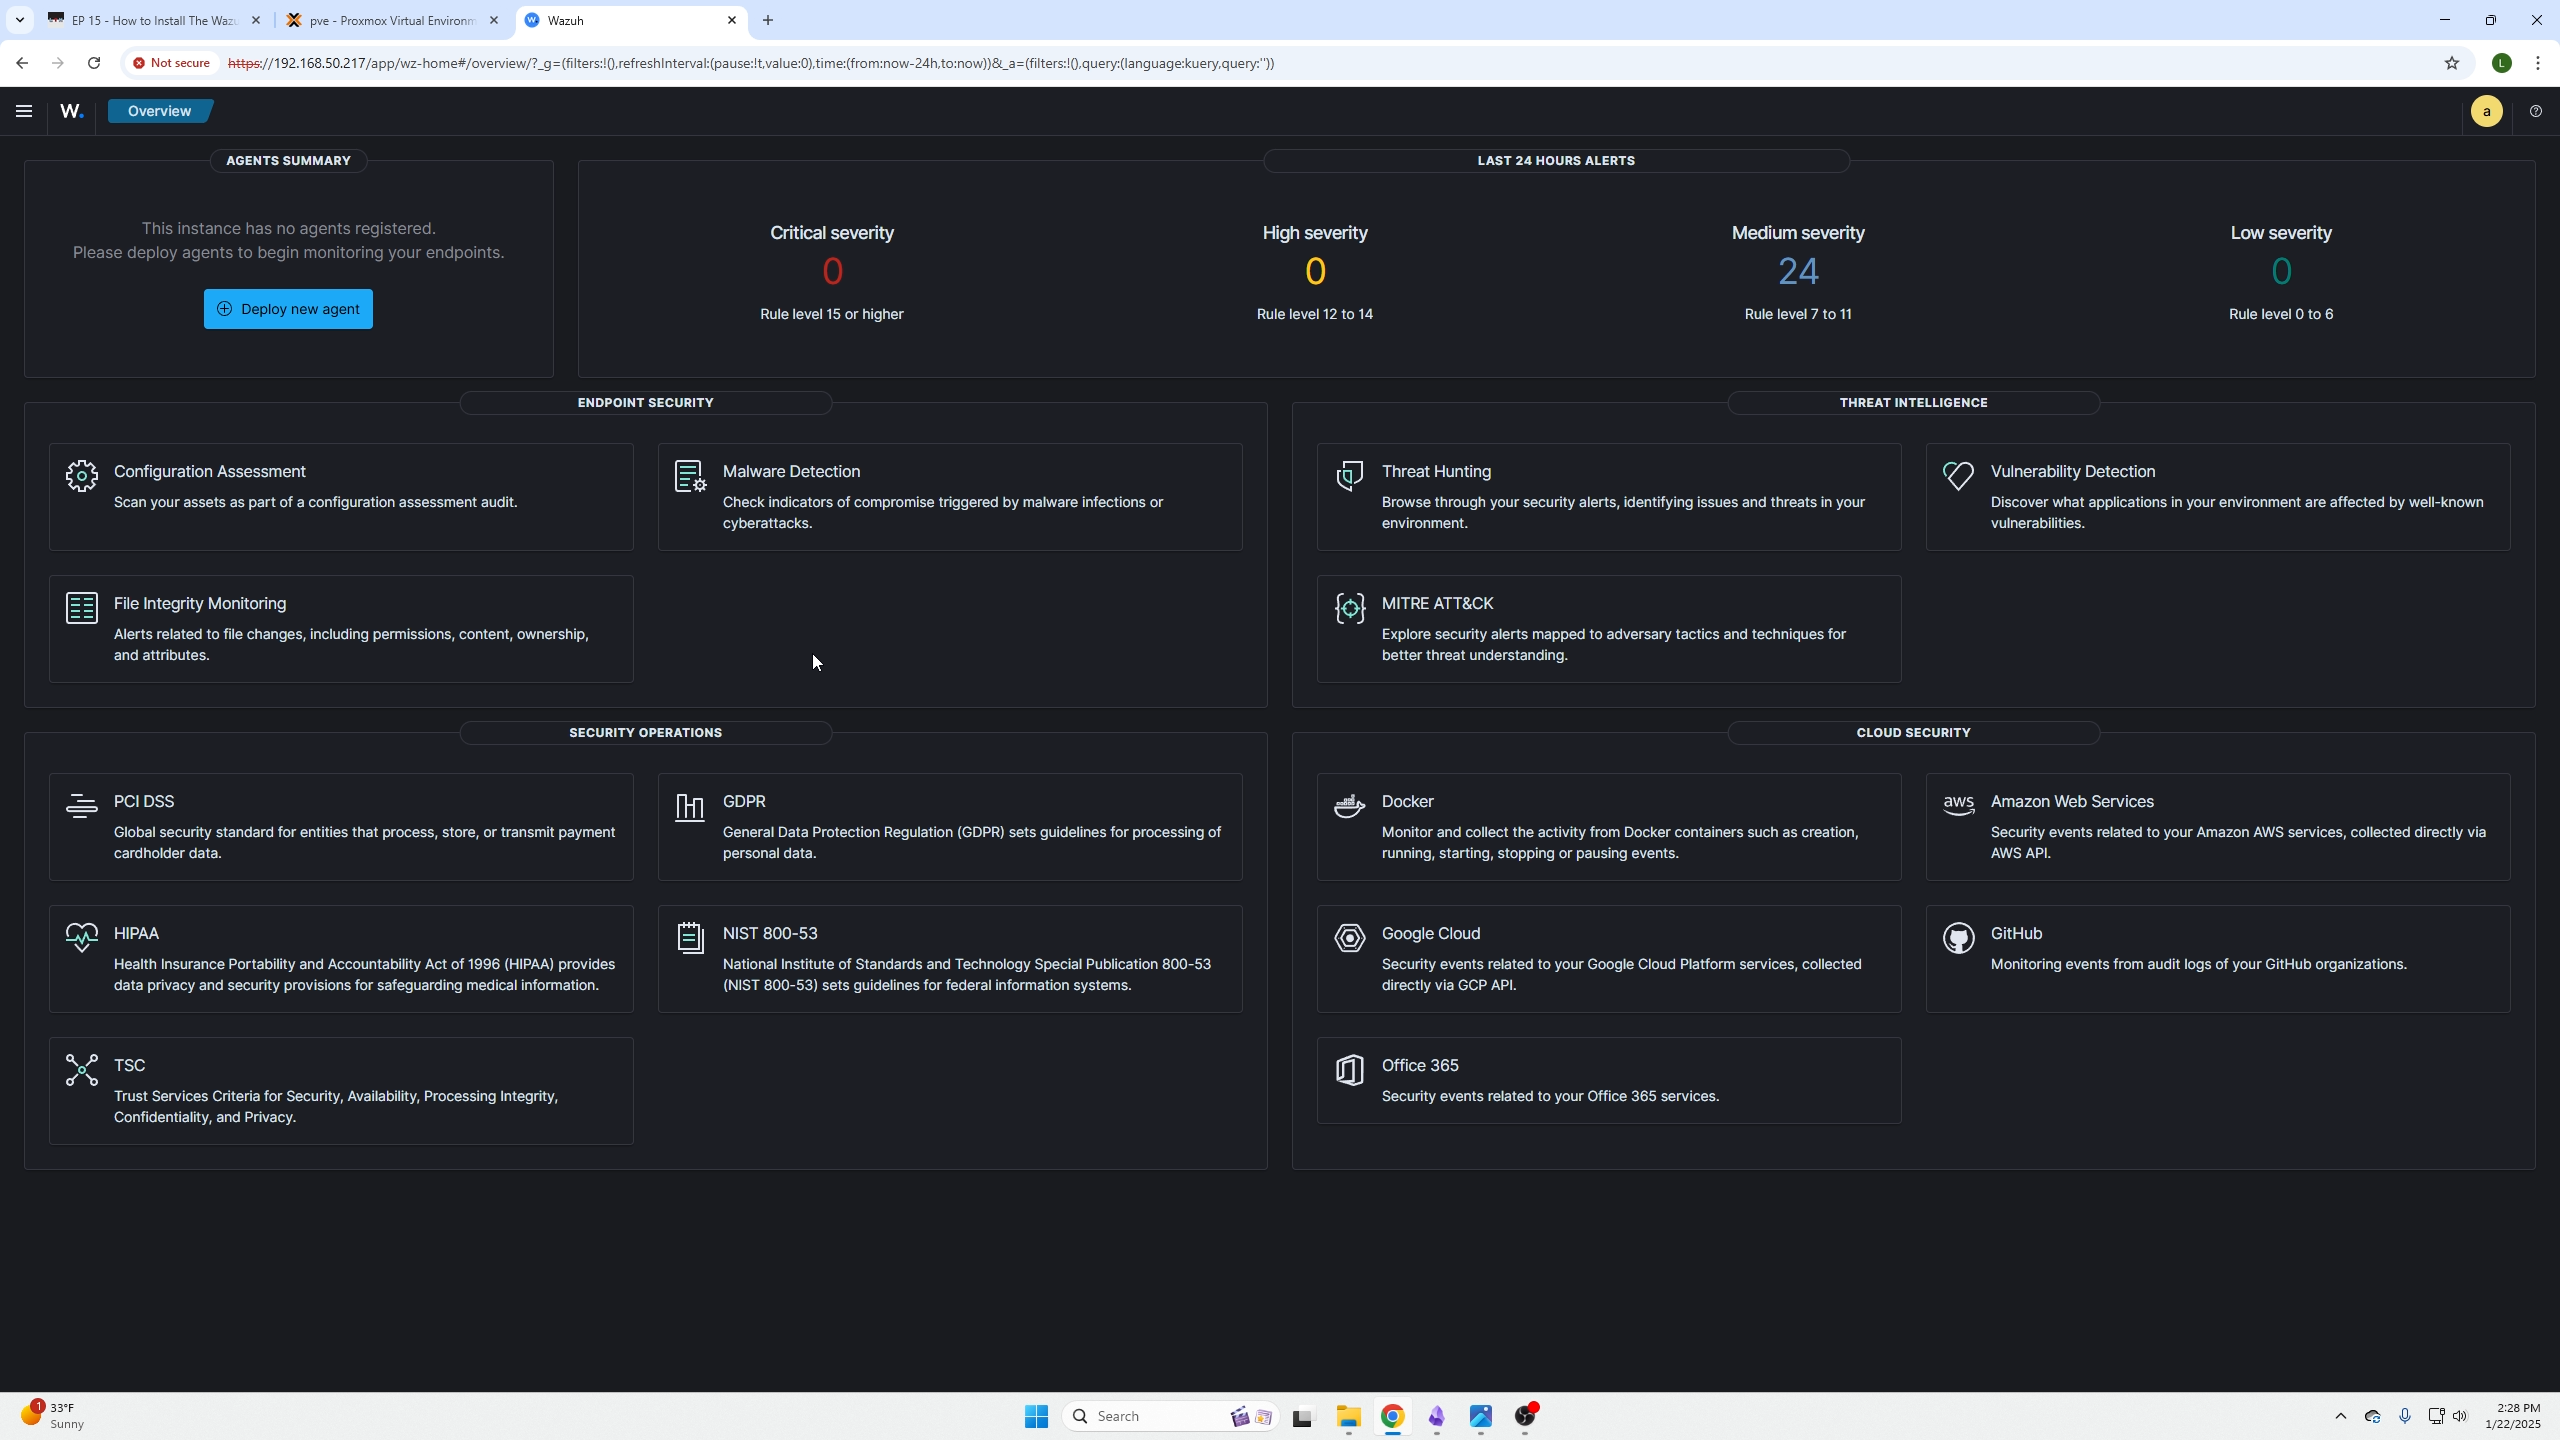
Login into your Wazuh Dashboard and on the top left you will see Deploy a new agent click in there.
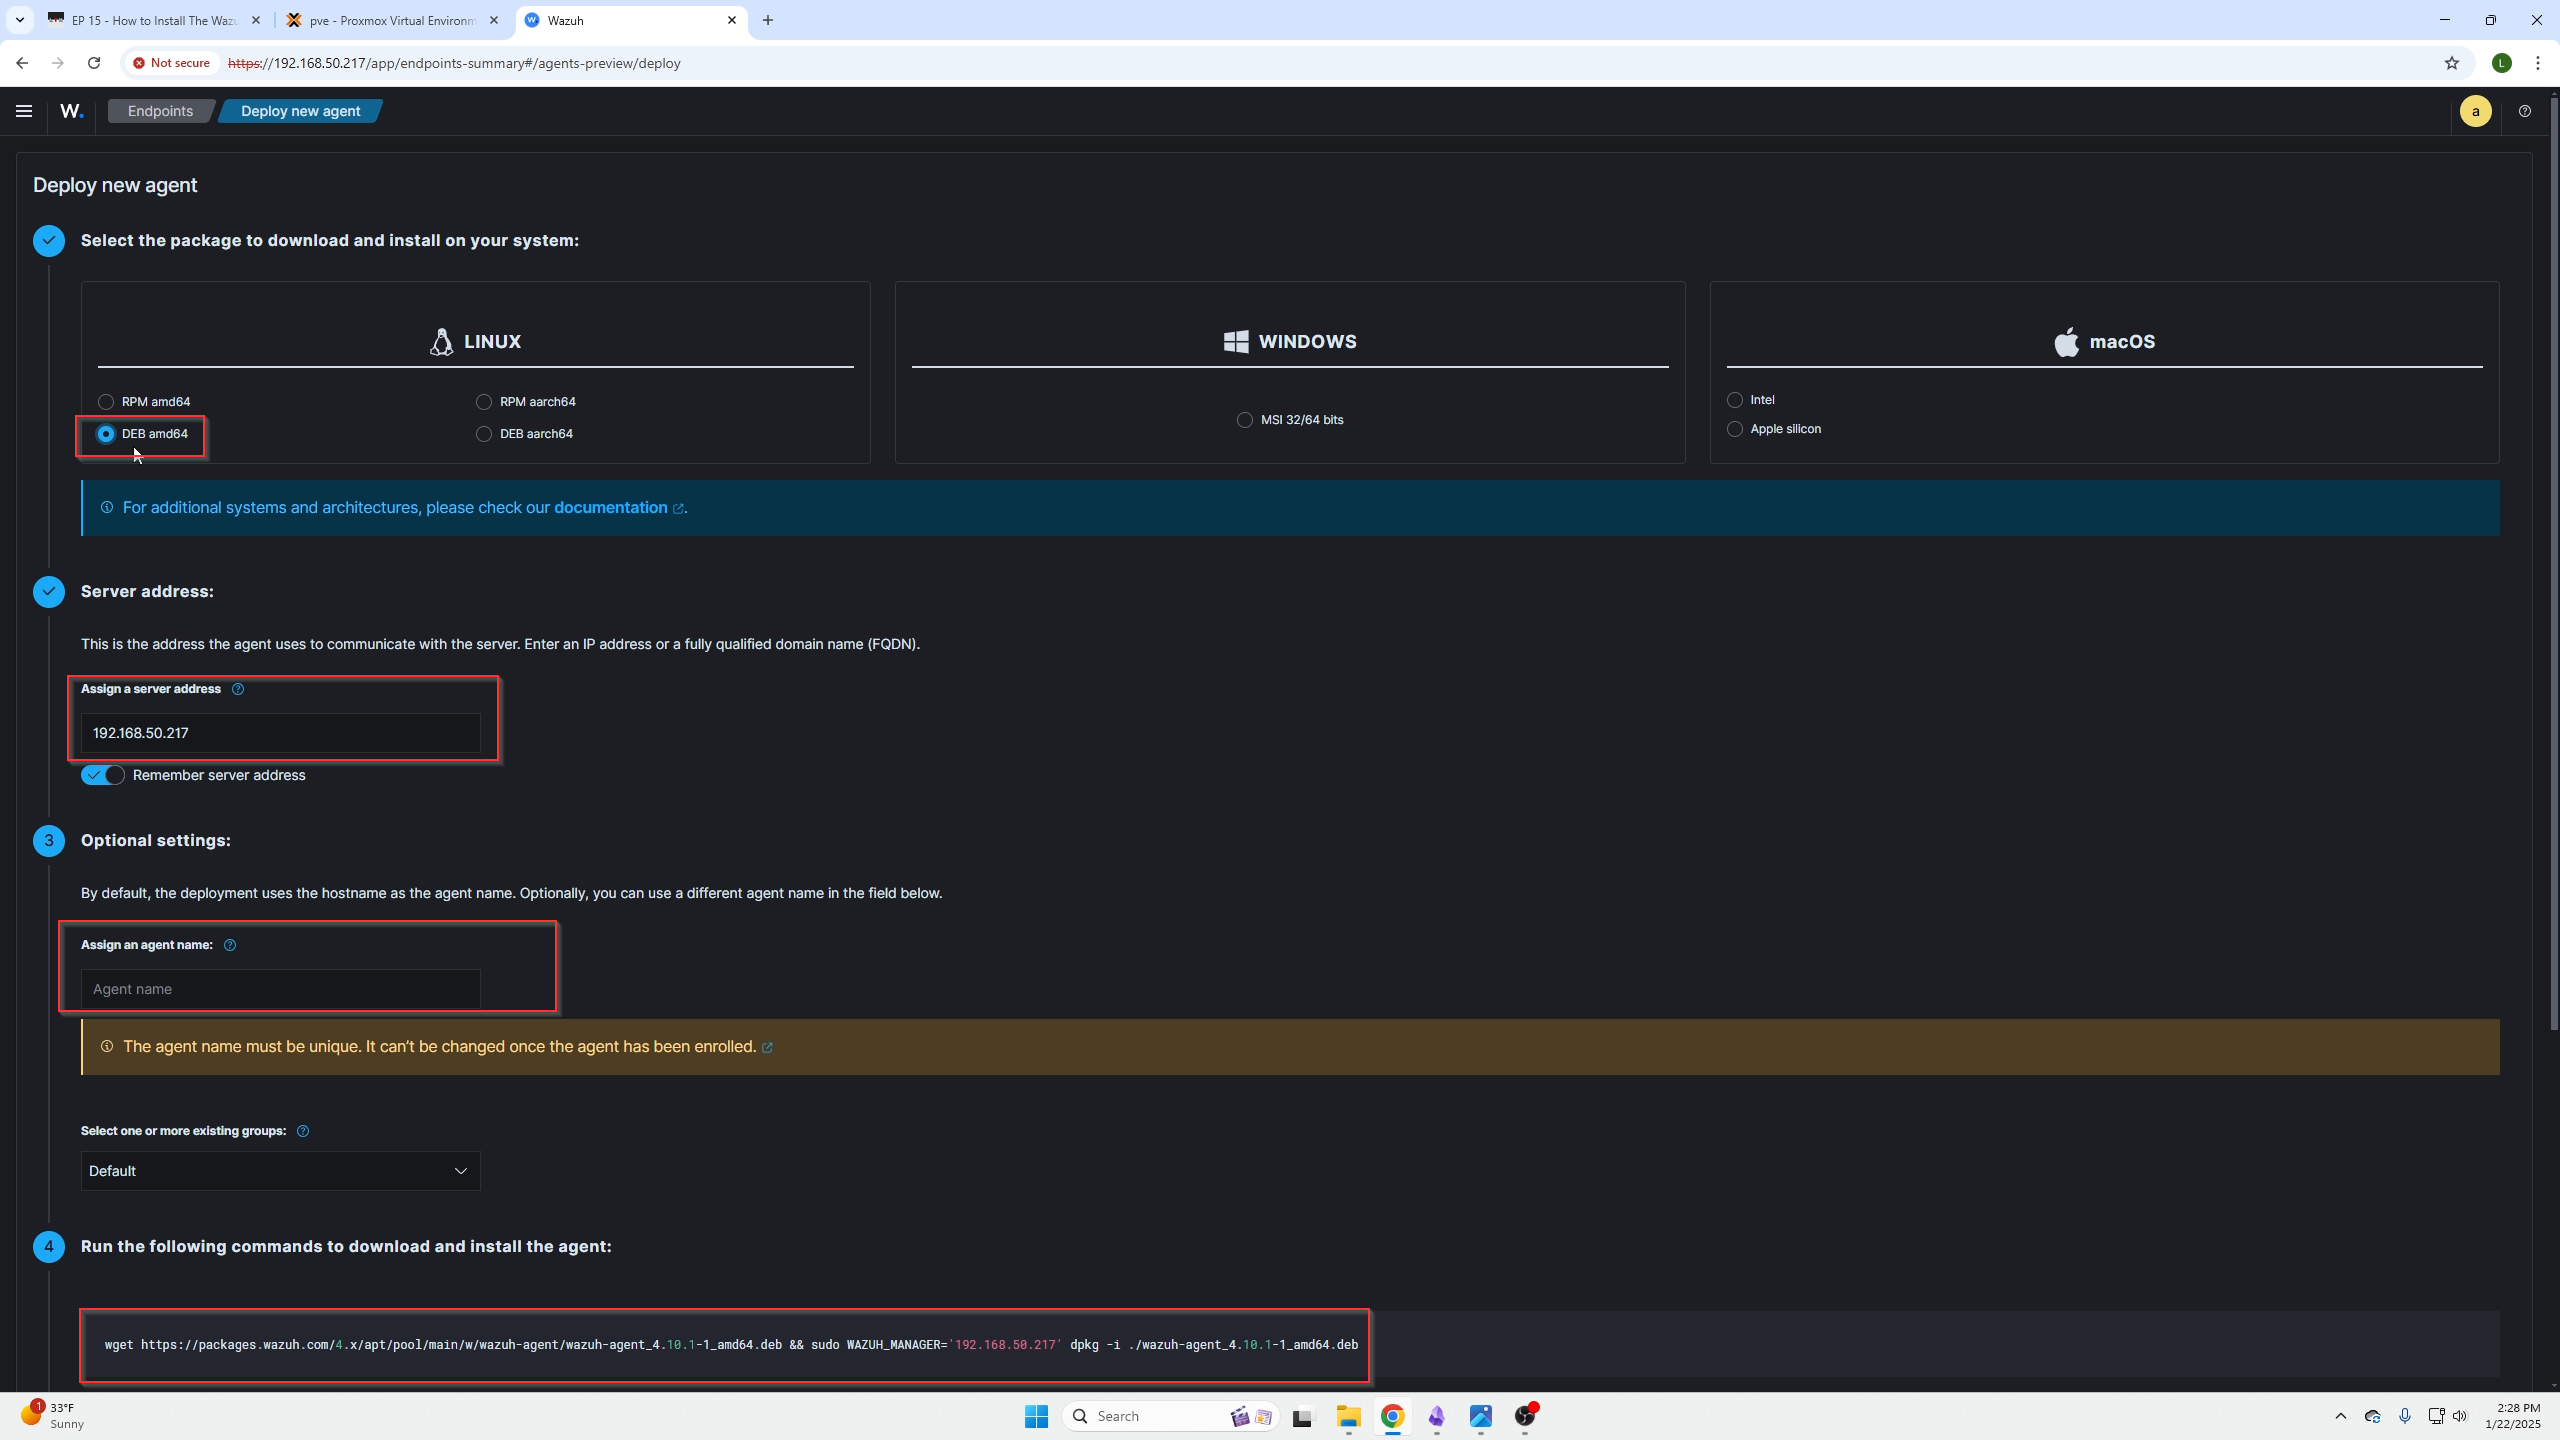
You need to select the OS type based on the machine you are planning to install the agent on. Our case is an Intel CPU (x86) and the operating system is Ubuntu which is Debian UNIX based so we will select DEB amd64.
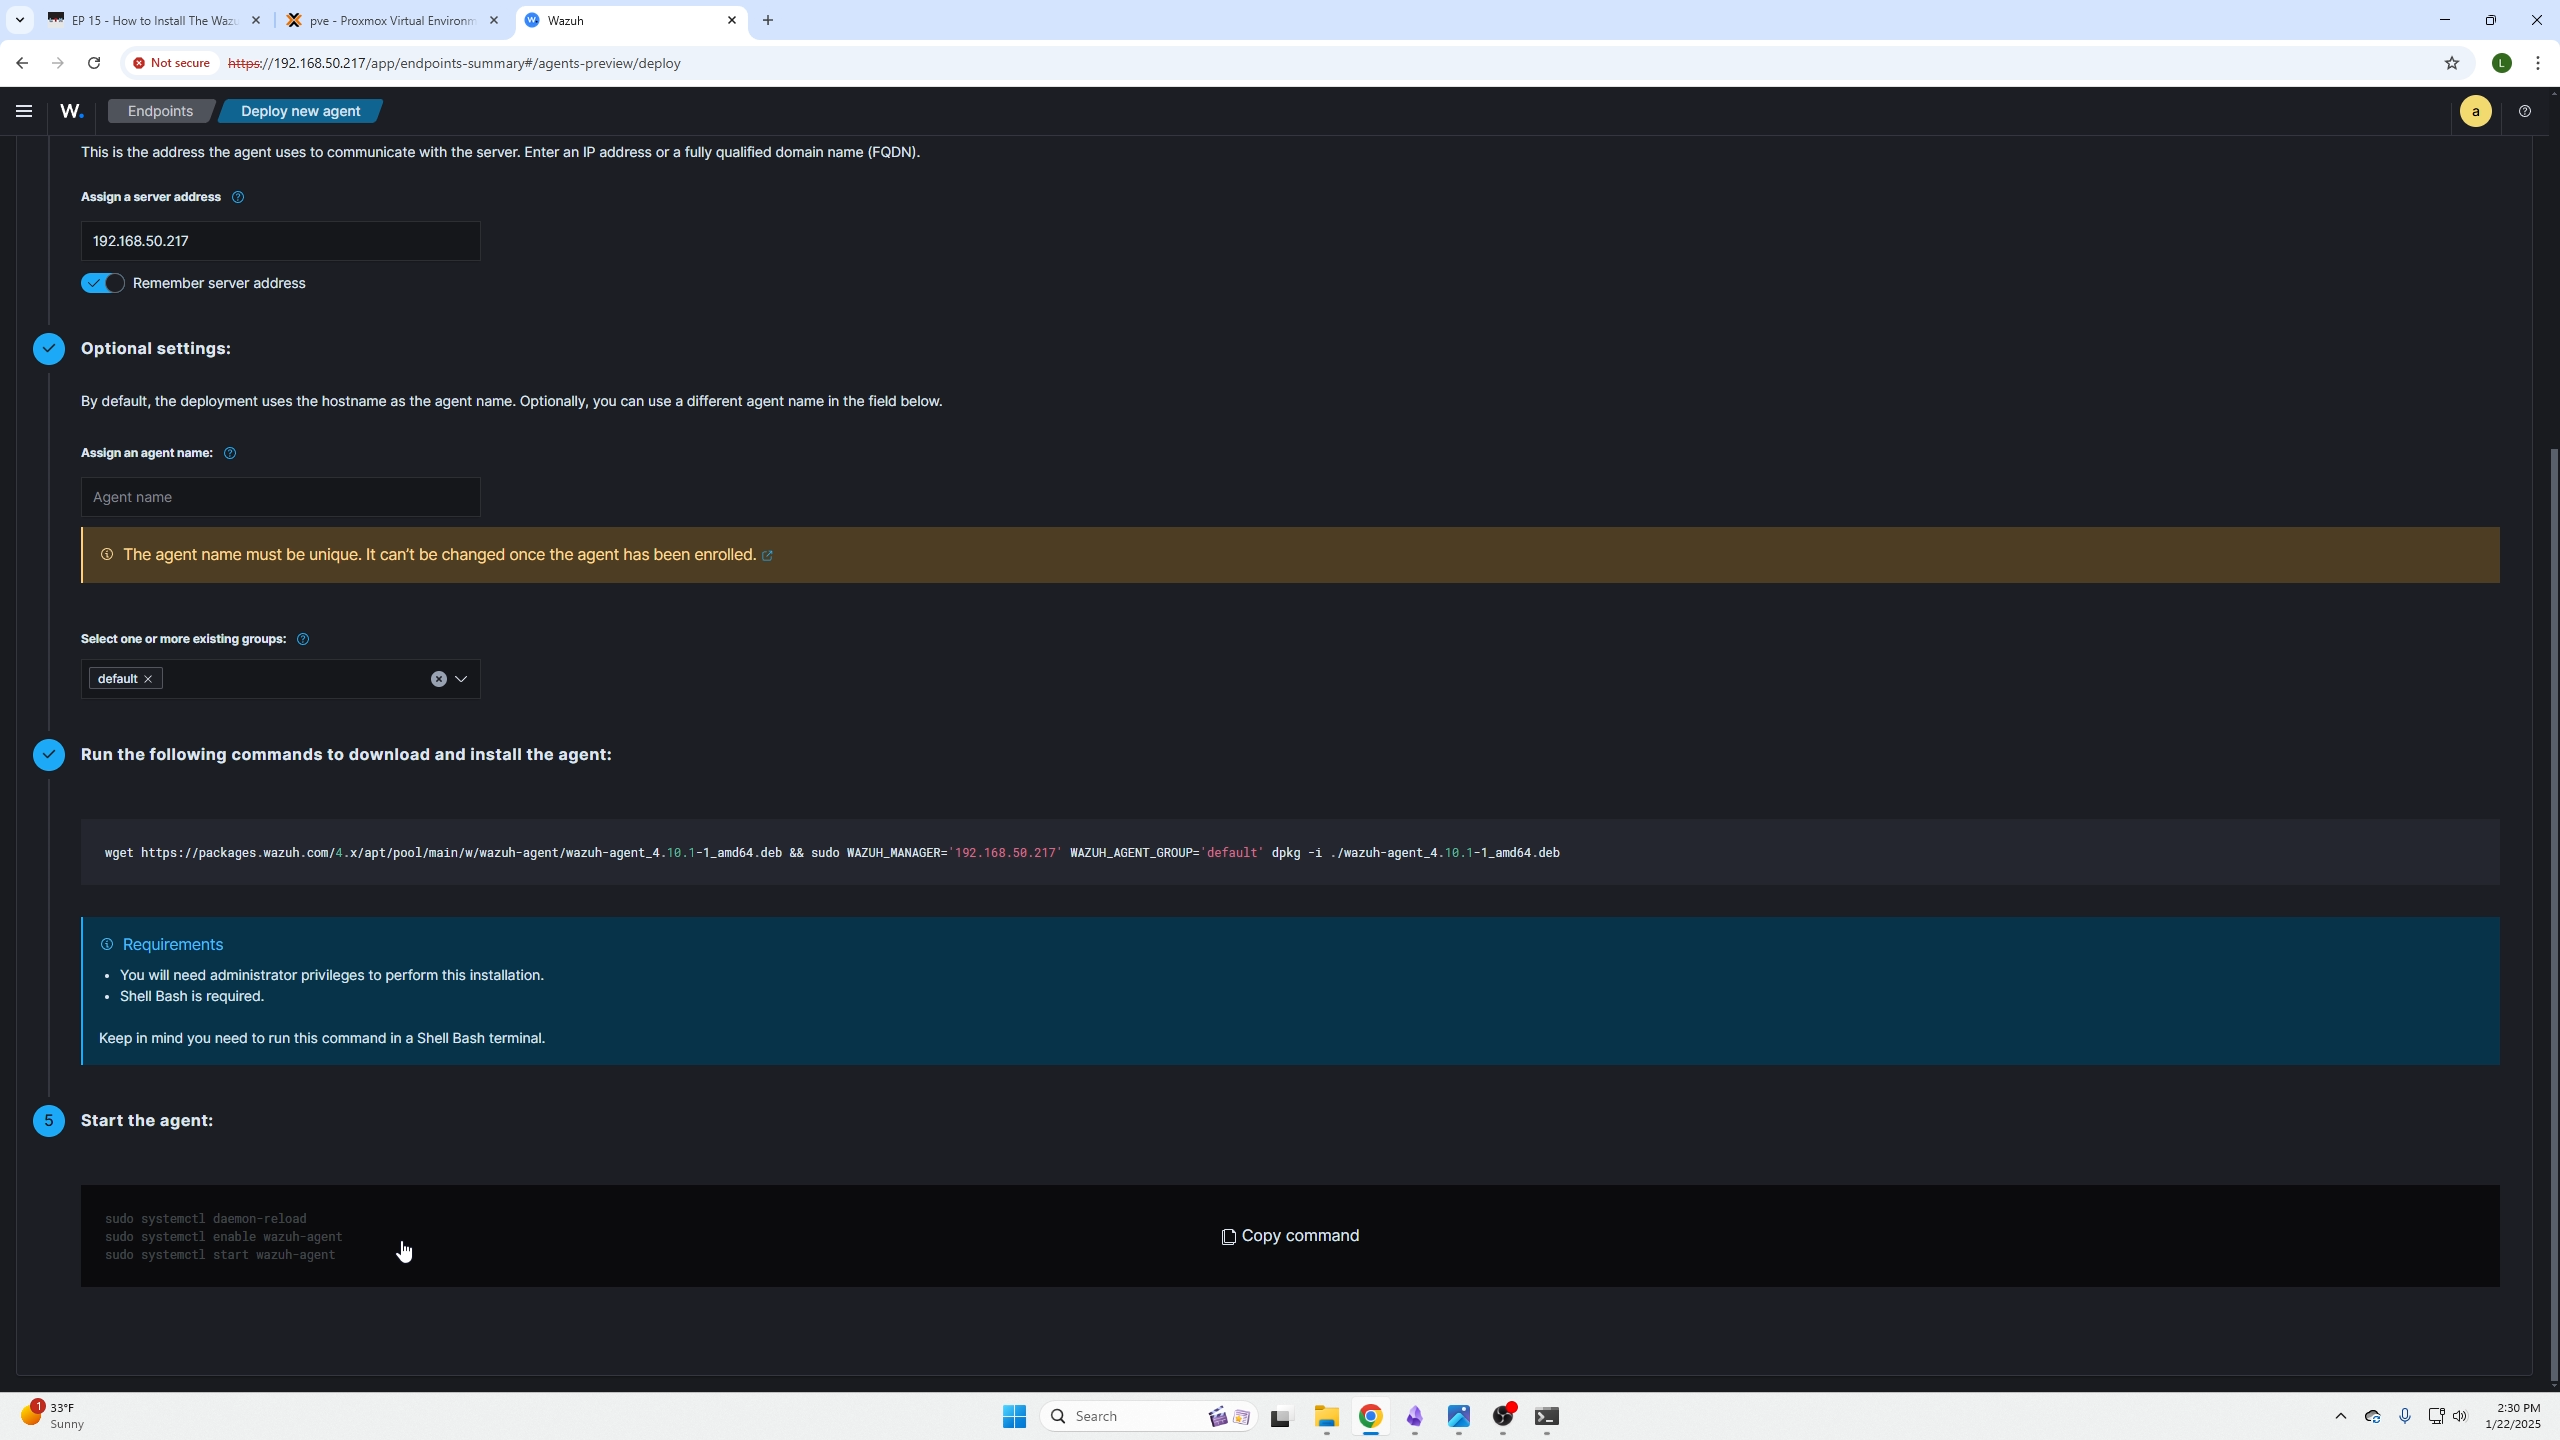
Next you will need to add the Wazuh Servers IP address into the Server address box. This makes sense because the indexer is found on the Wazuh server where your dashboard is also being hosted.
You can rename the node where you are installing the agent if like.
Lastly, we can see step 4 there is a script we need to copy and paste into the node we are installing the Agent on.
Next, SSH into your machine and based that script.
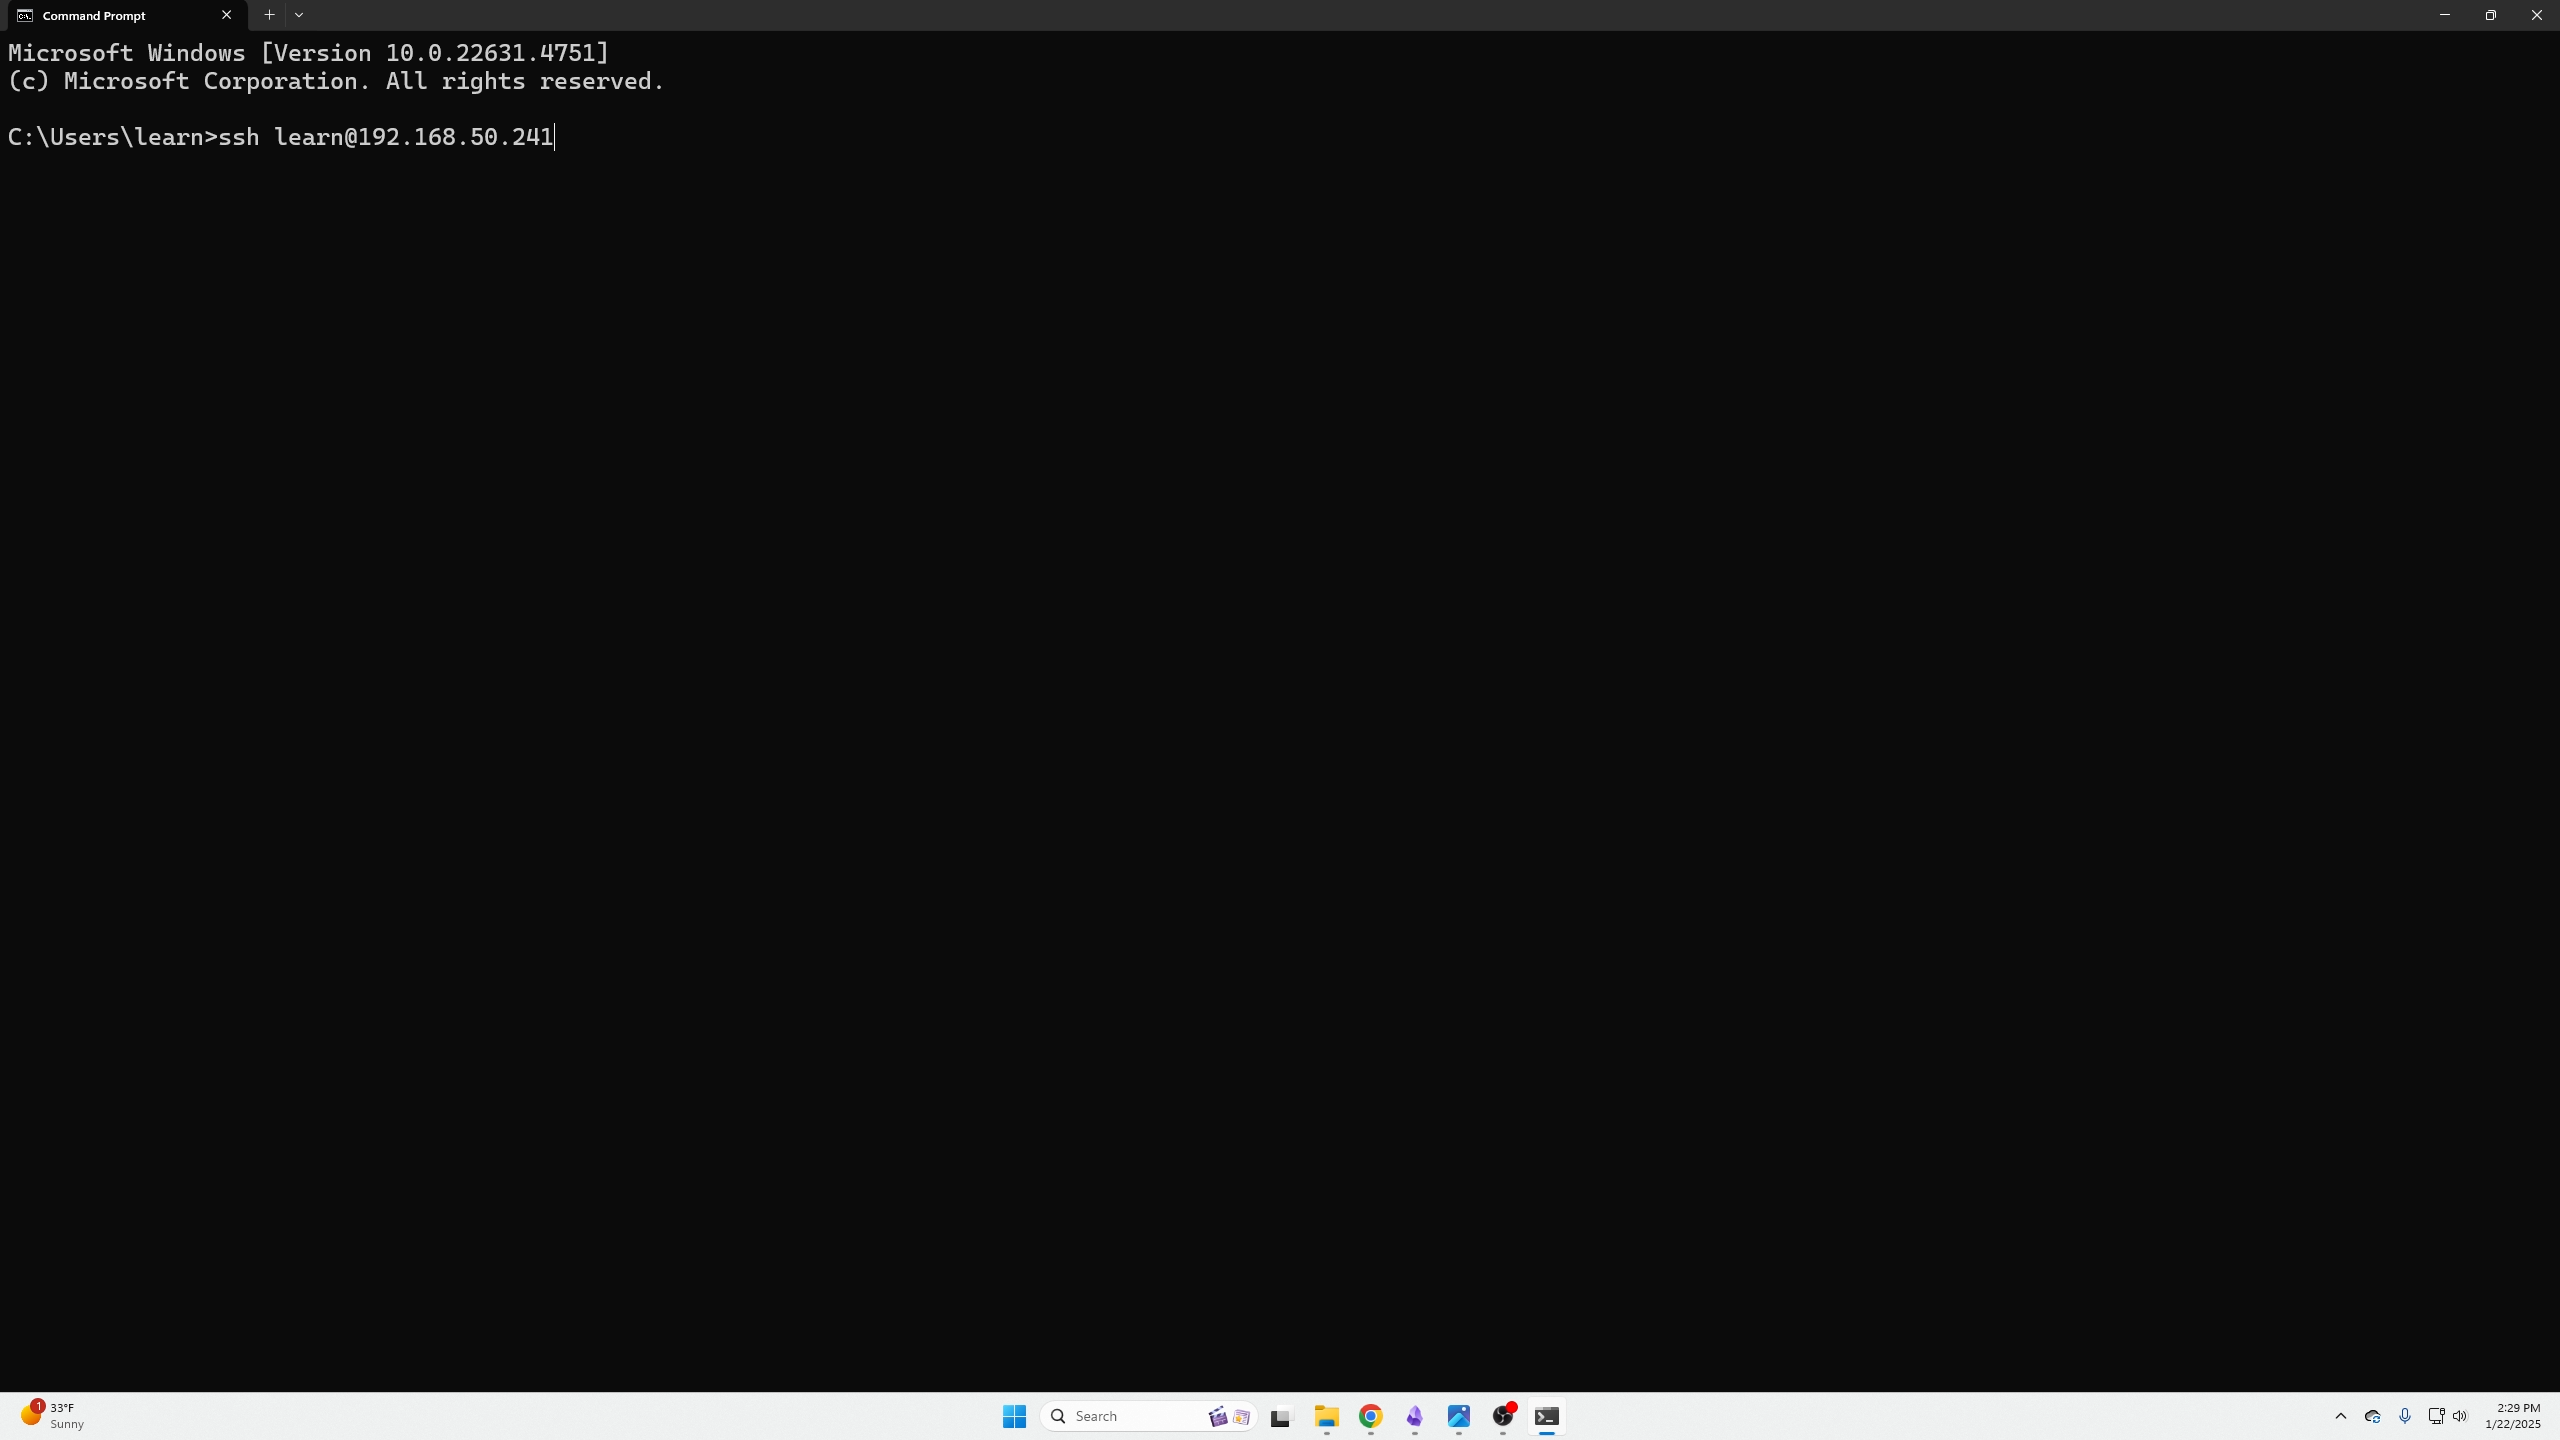
(Script pasted from the dashboard shown earlier)
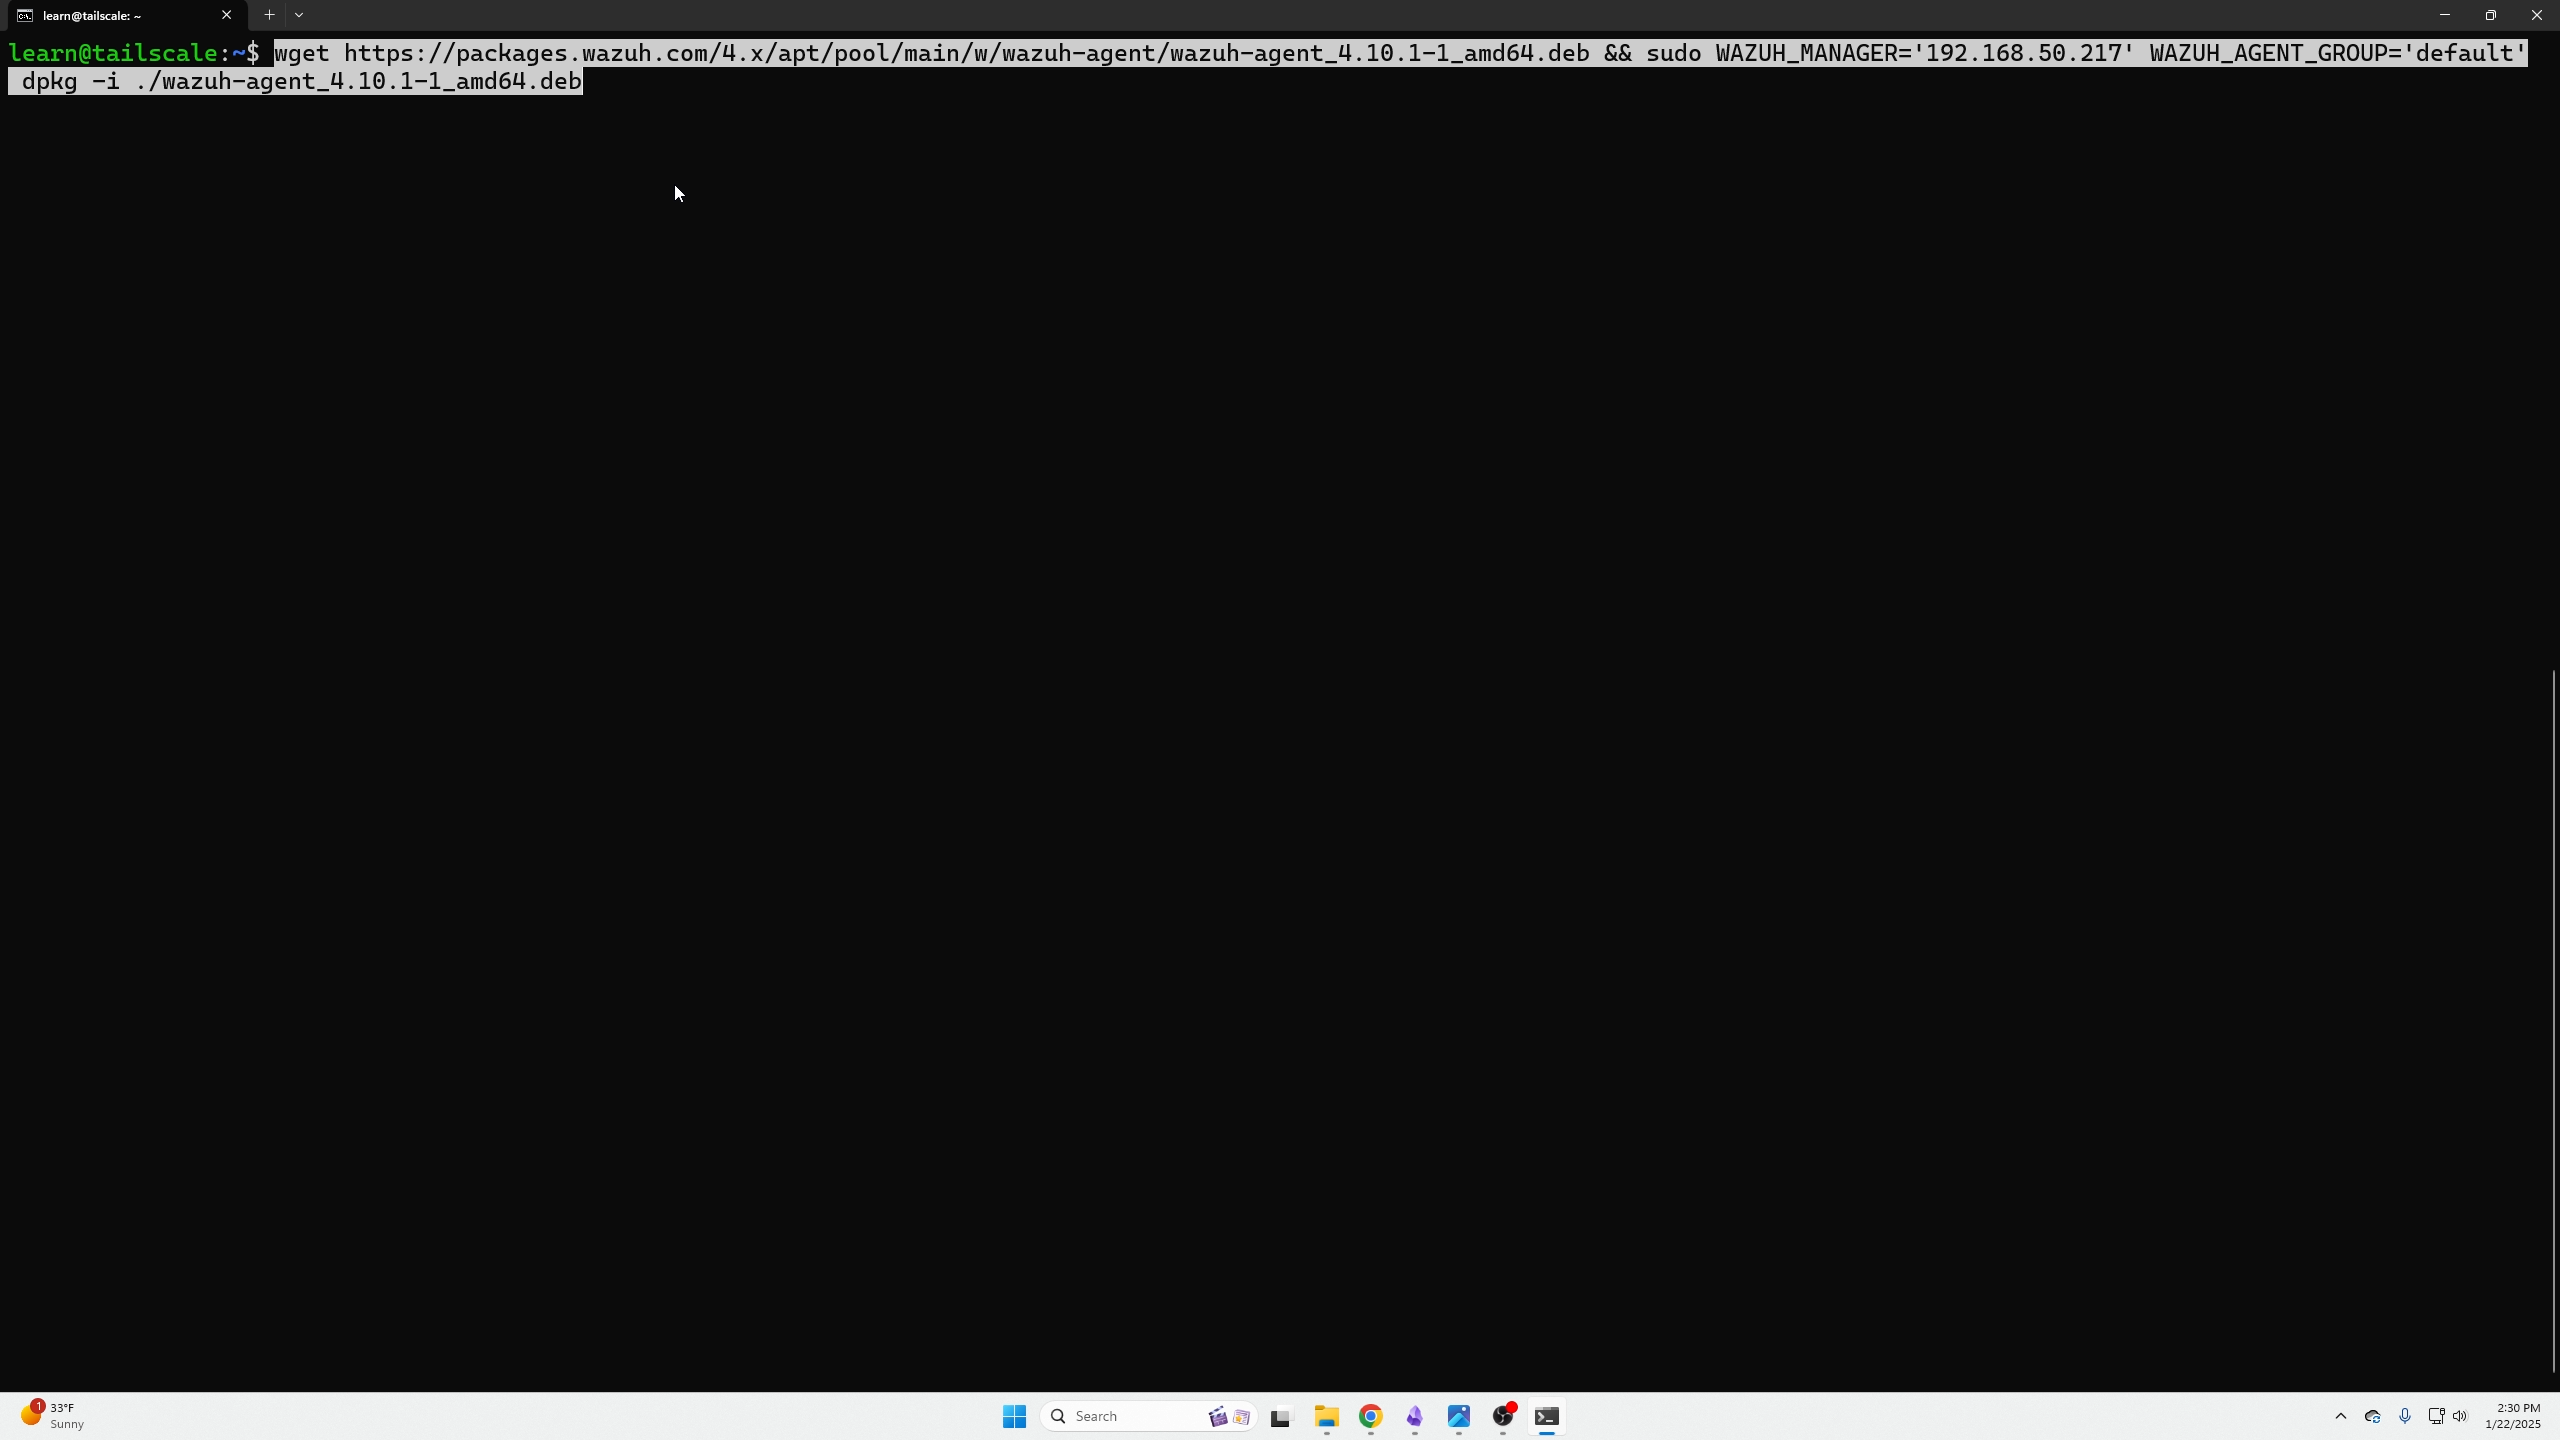
After that is done we can grab the last part from the dashboard in step 5. This restarts the agent, and ensures it persists on the machine.
Step 5 commands depend on what OS you choose but here is the example for Debian Linux
(pasting the commands from step 5 onto the machine we installed the agent on)

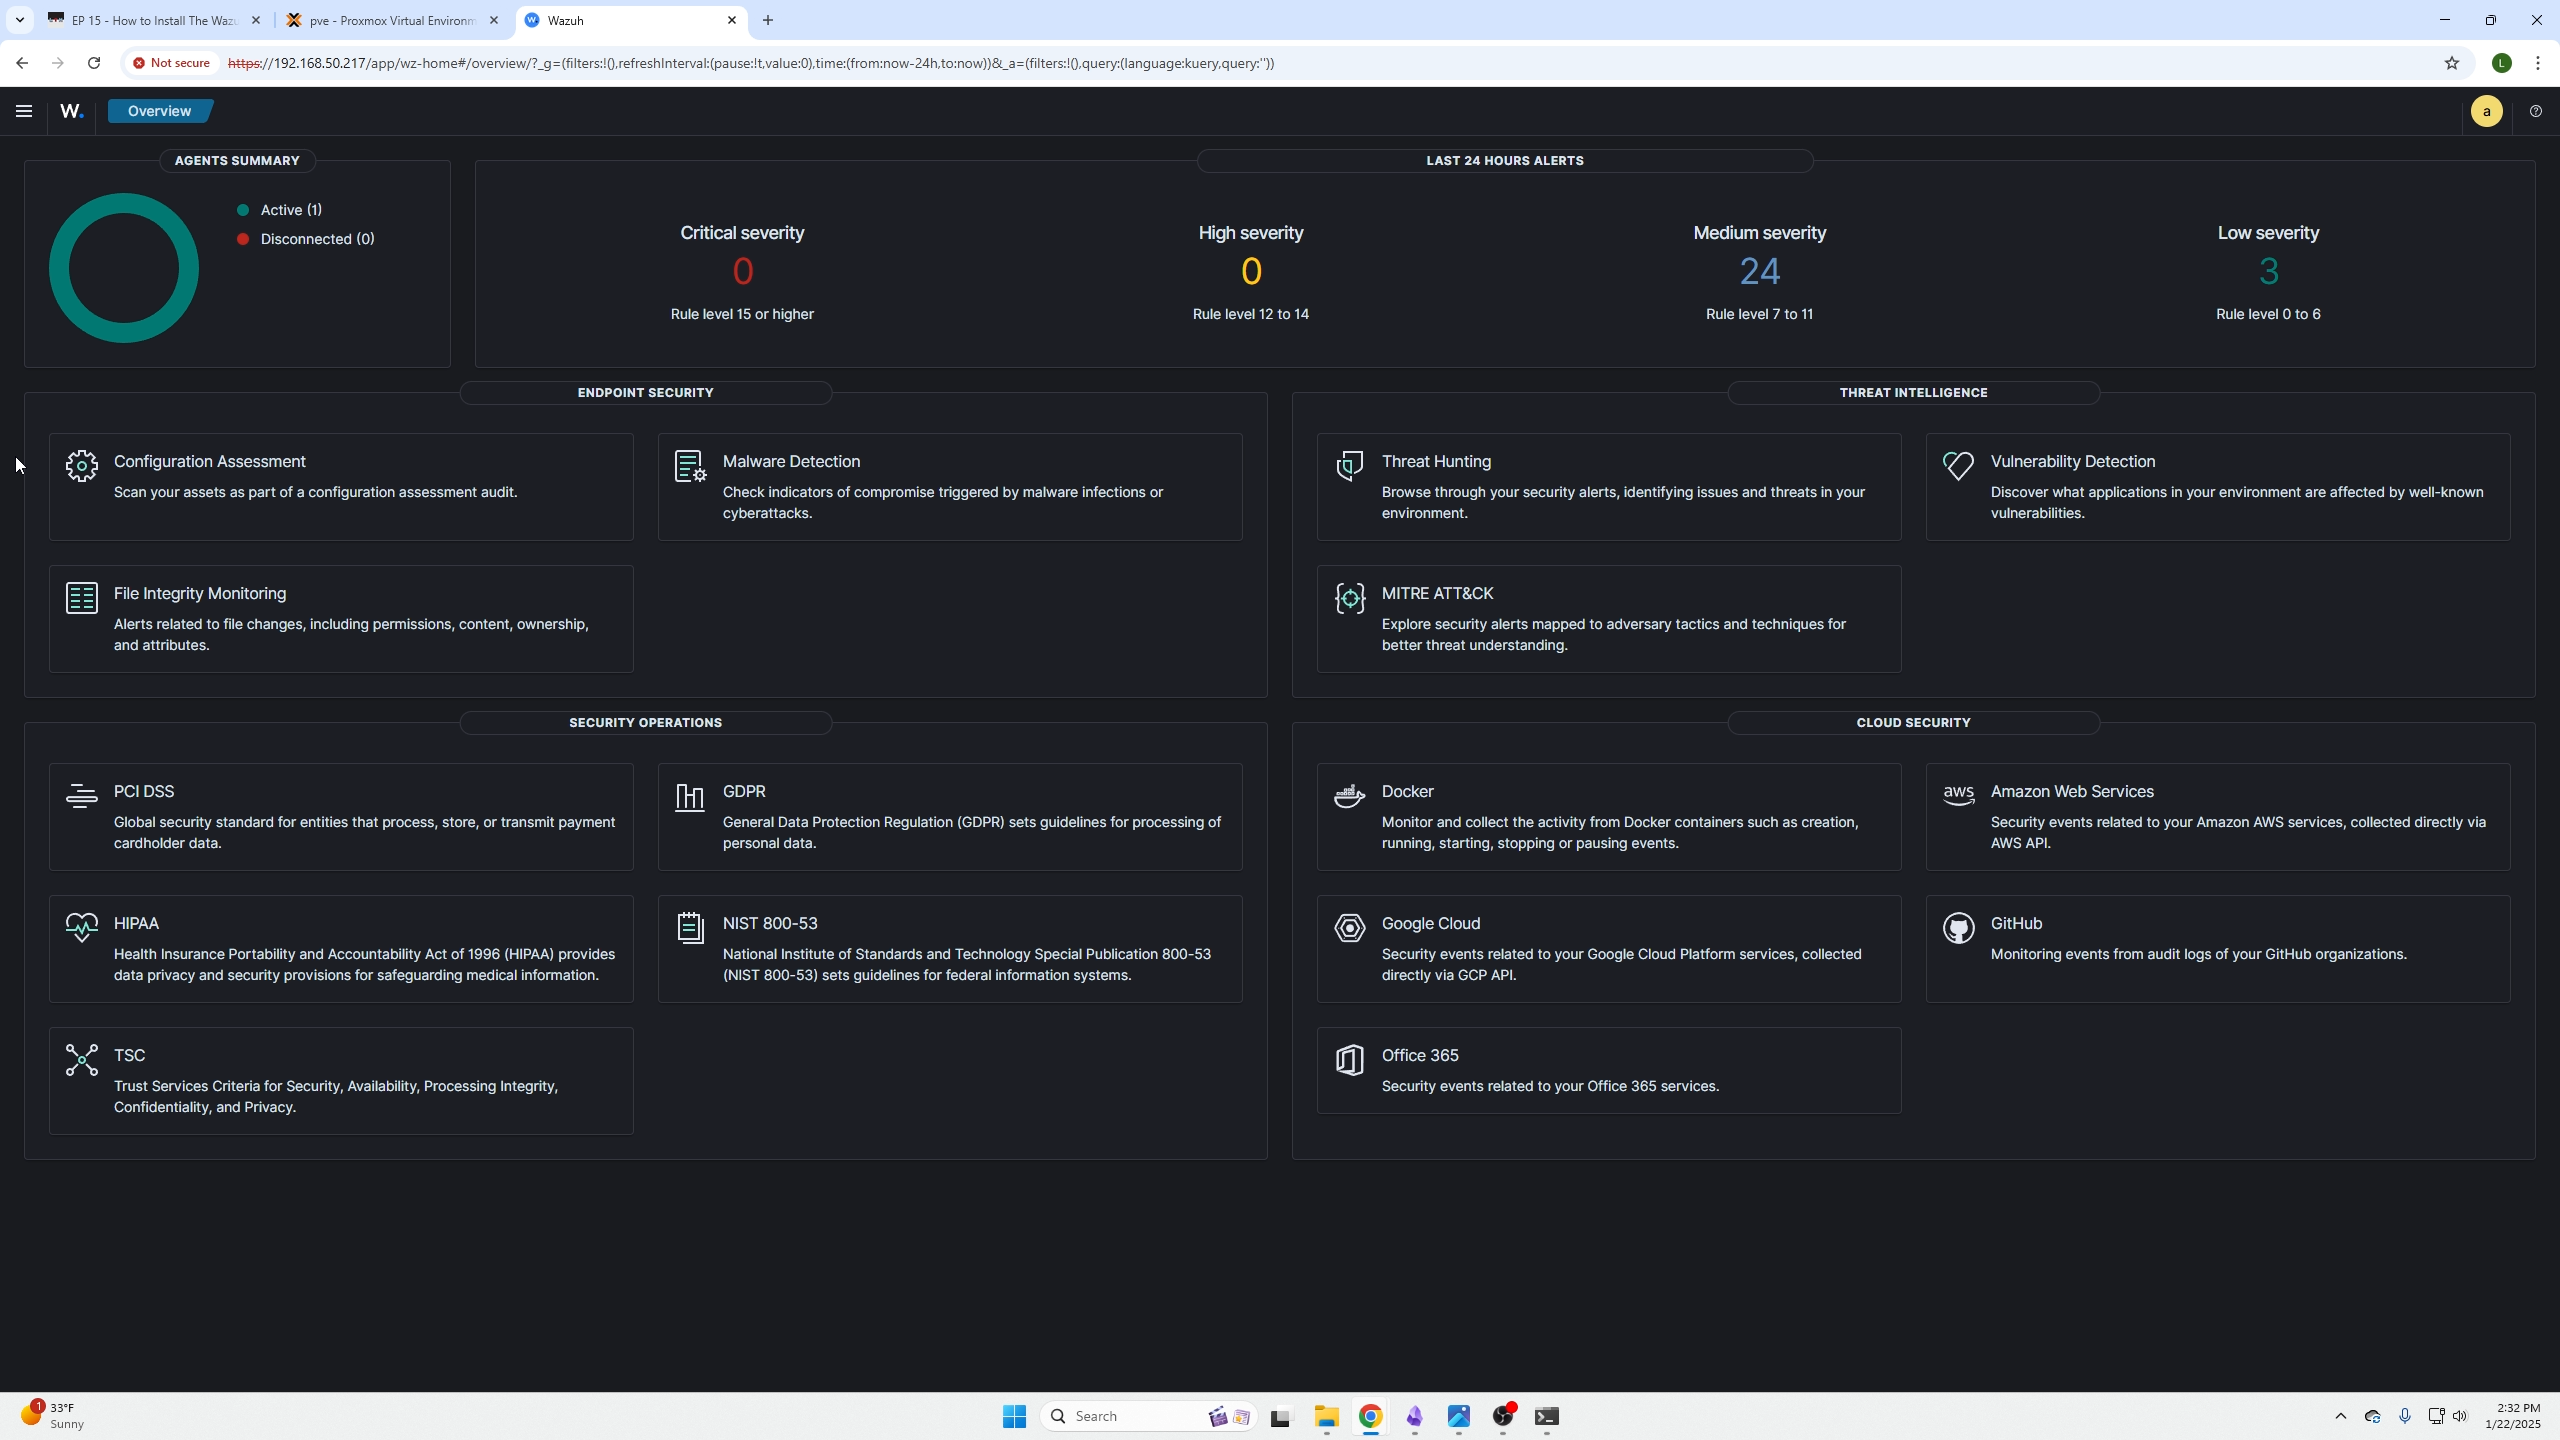
Go back to your dashboard and wait a couple minutes, on the top left you will then see your agent communicating with the Wazuh server.
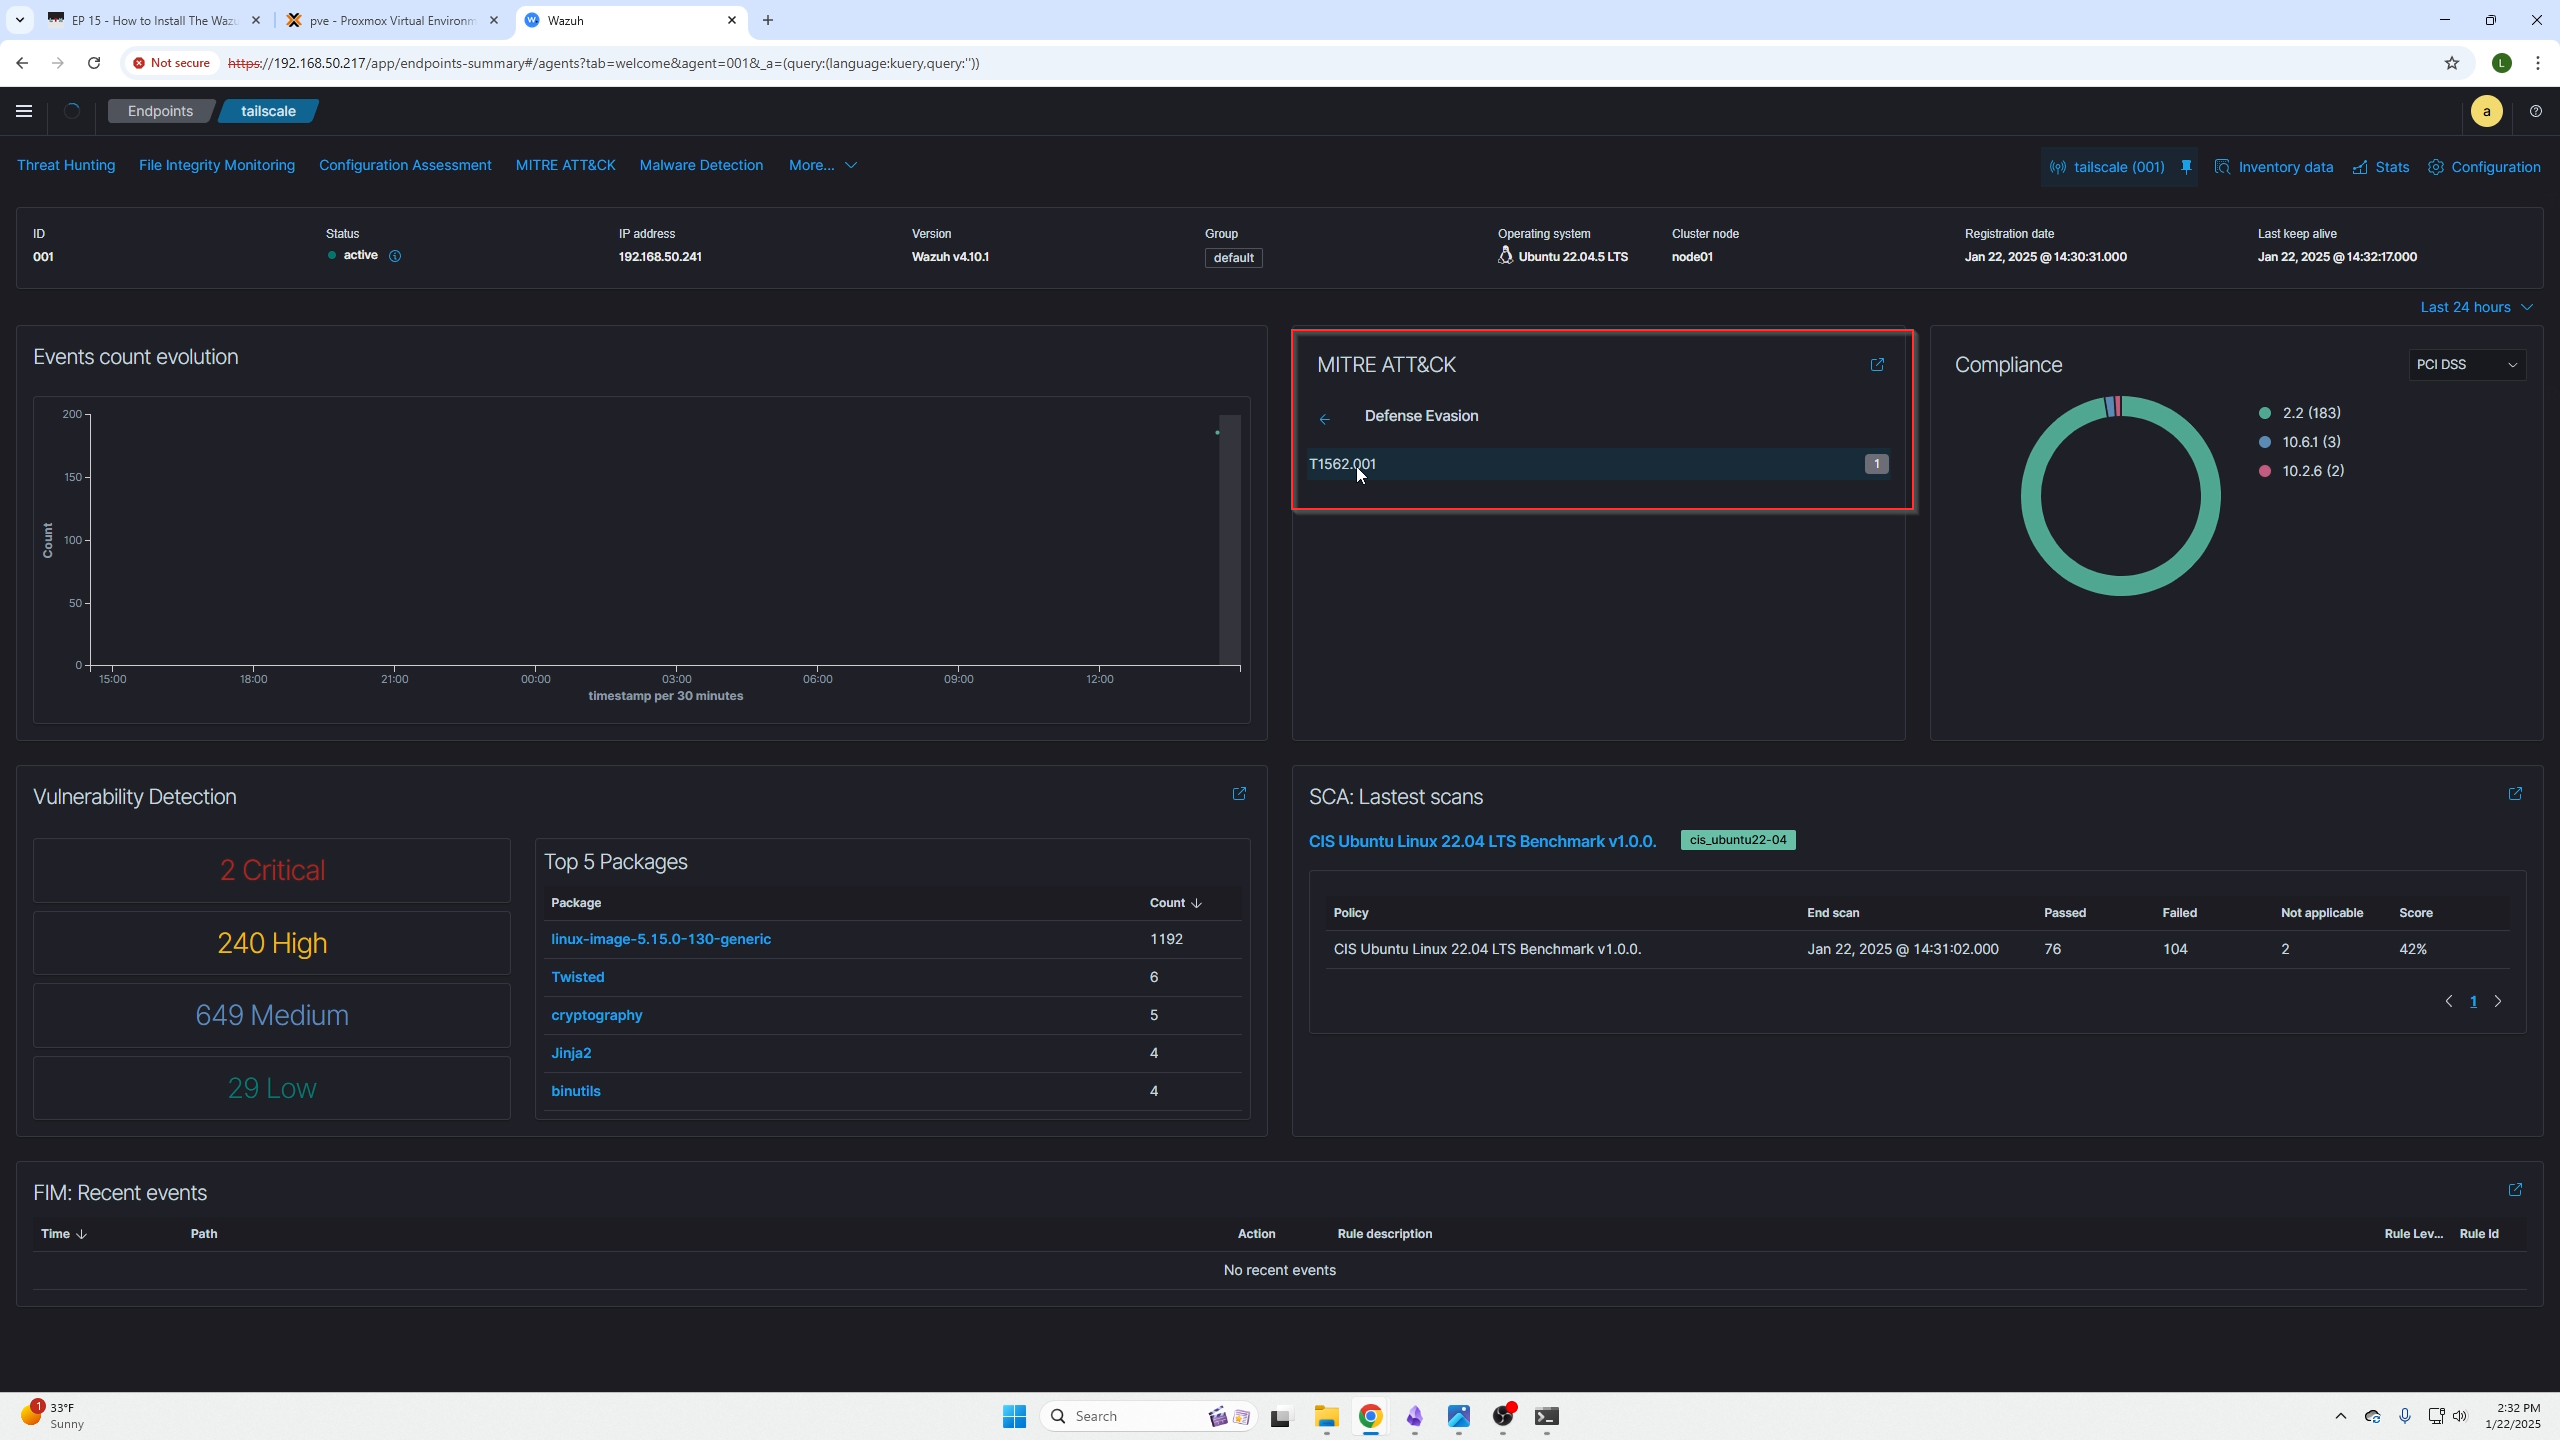
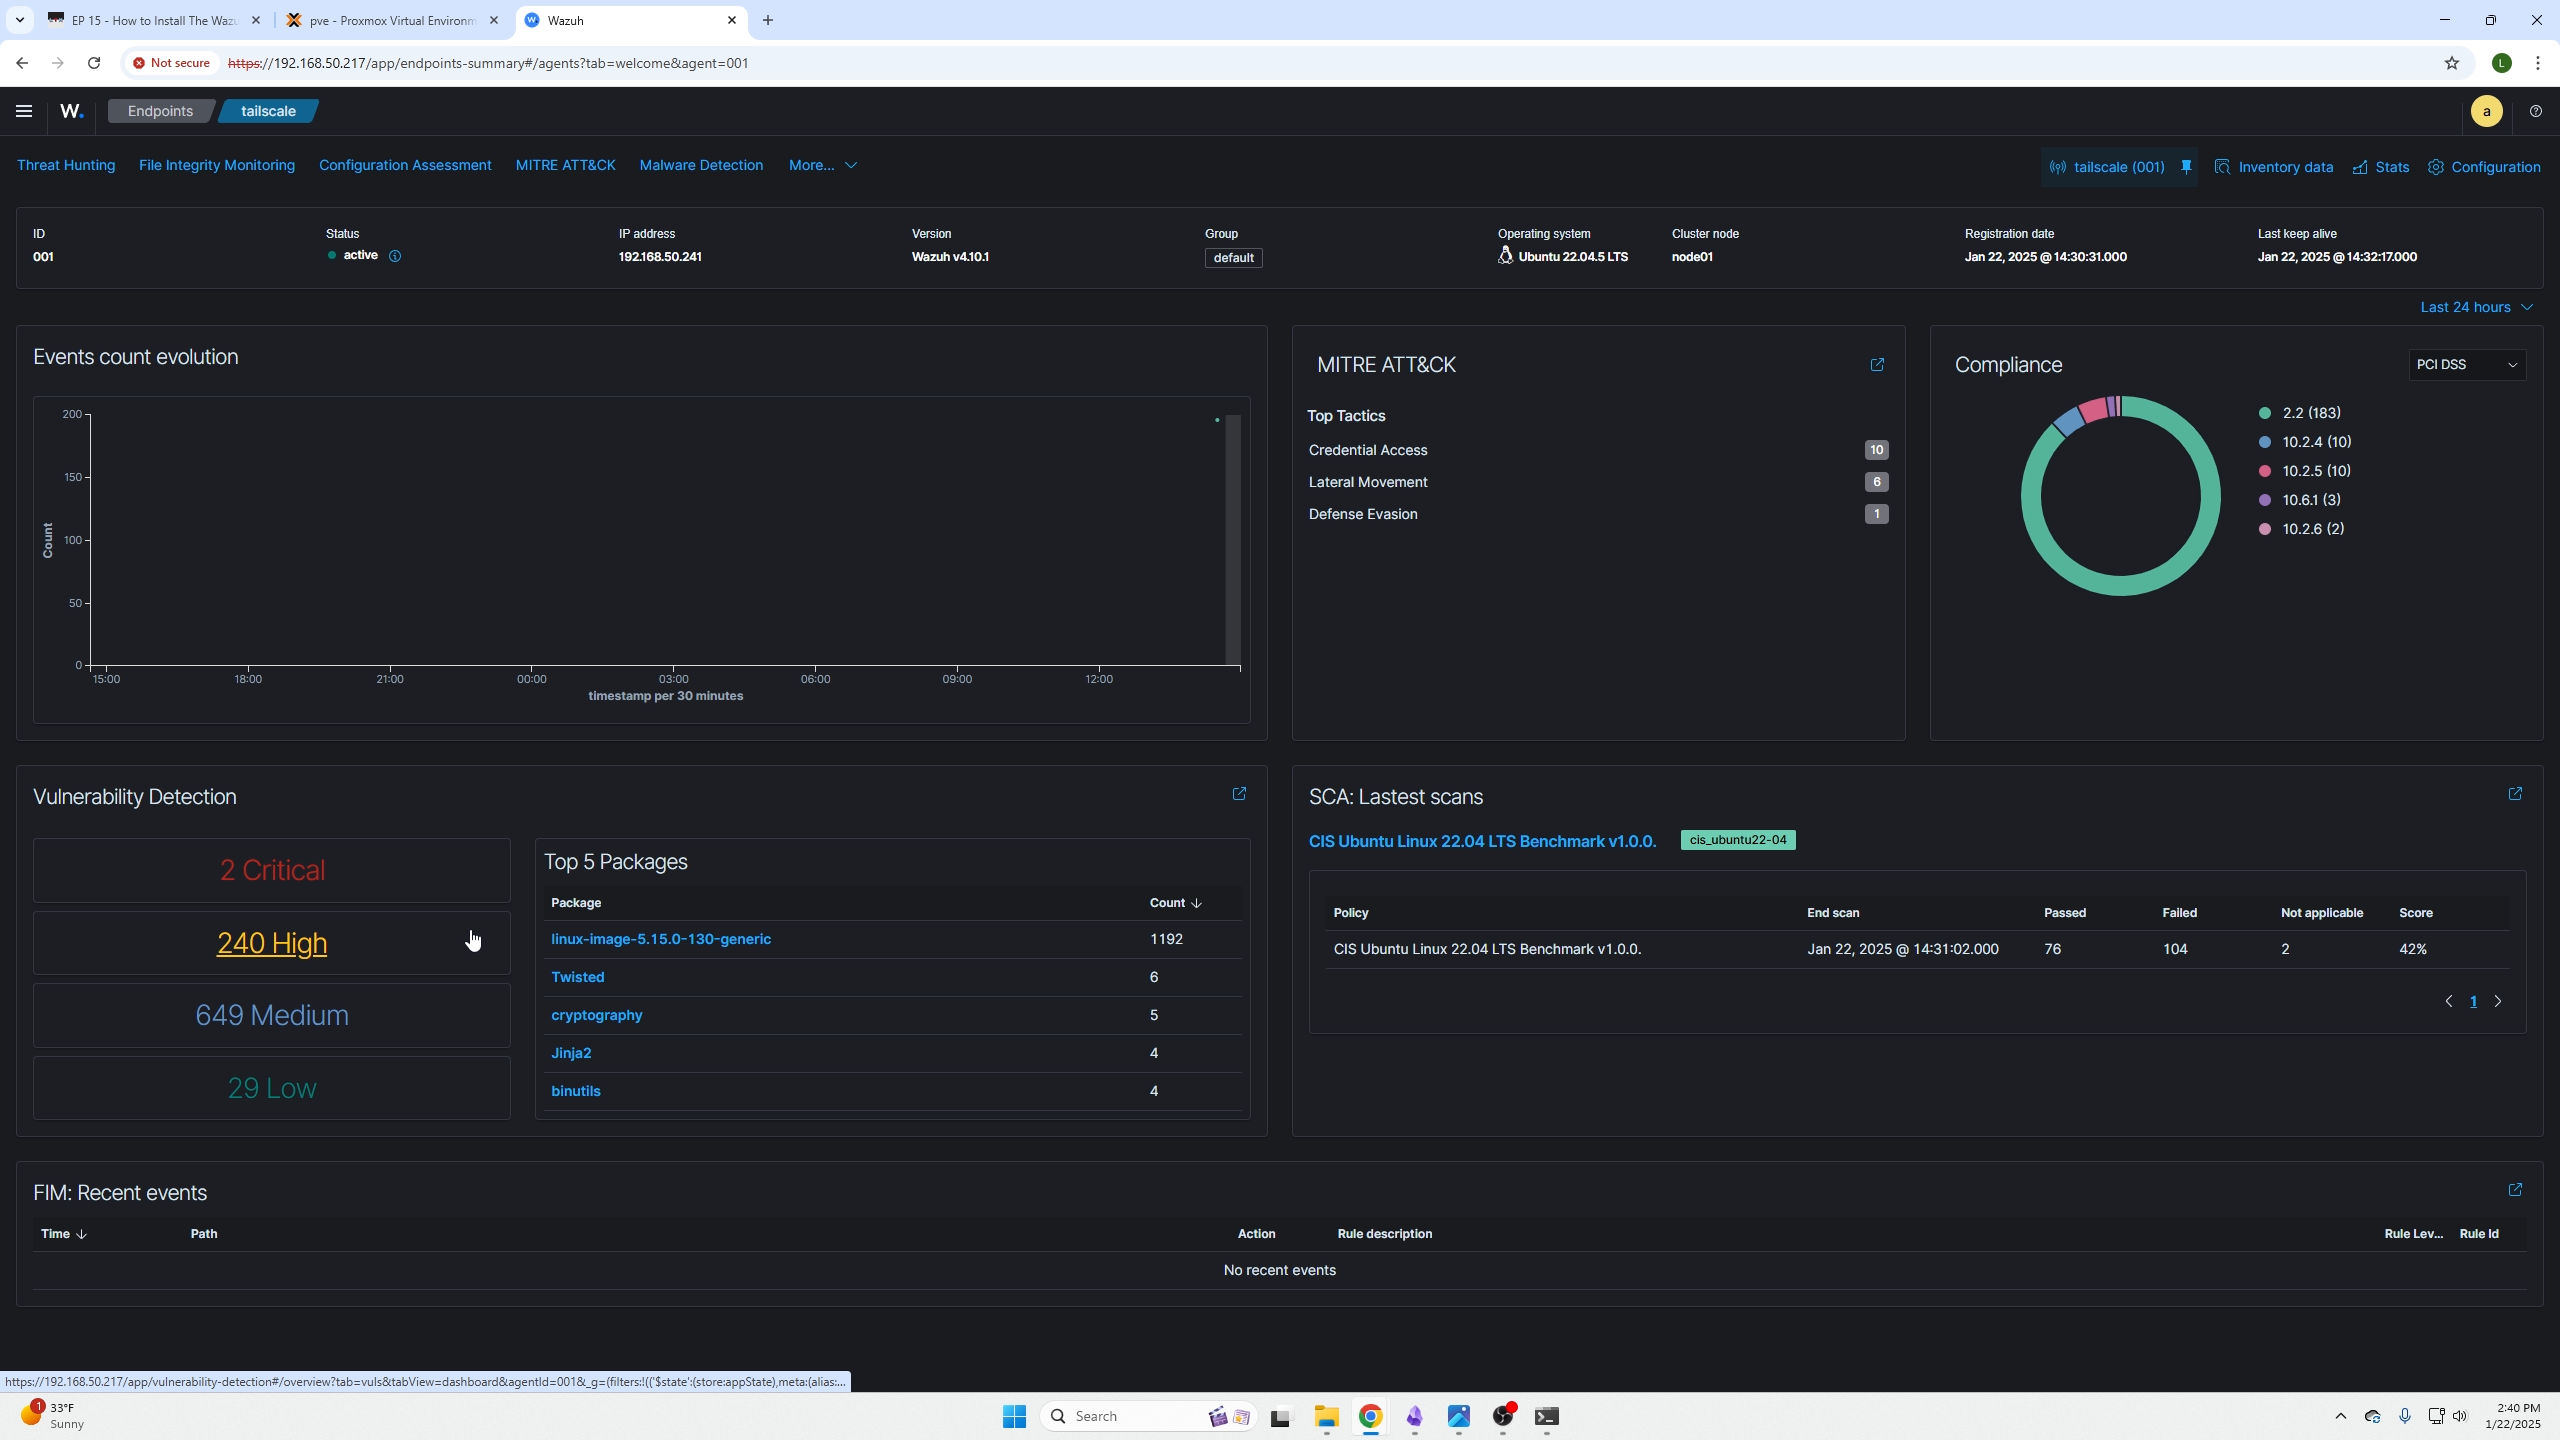
By clicking on that section and the specific agent, you will be presented with the agent dashboard. By clicking the items found in the red box you will be presented with your devices findings based on the agent scans.
Here is a list of all the issues found. You can open them up and read important sections like the description to better understand the issue.
Searching all indexed items
Opening the menu on the top right, going under the explore section and selecing discover allows you to search your whole network and all indexes that the agents create. An index is essentially every event on every live agent that occurs on the device as long as its being recorded by the agent.

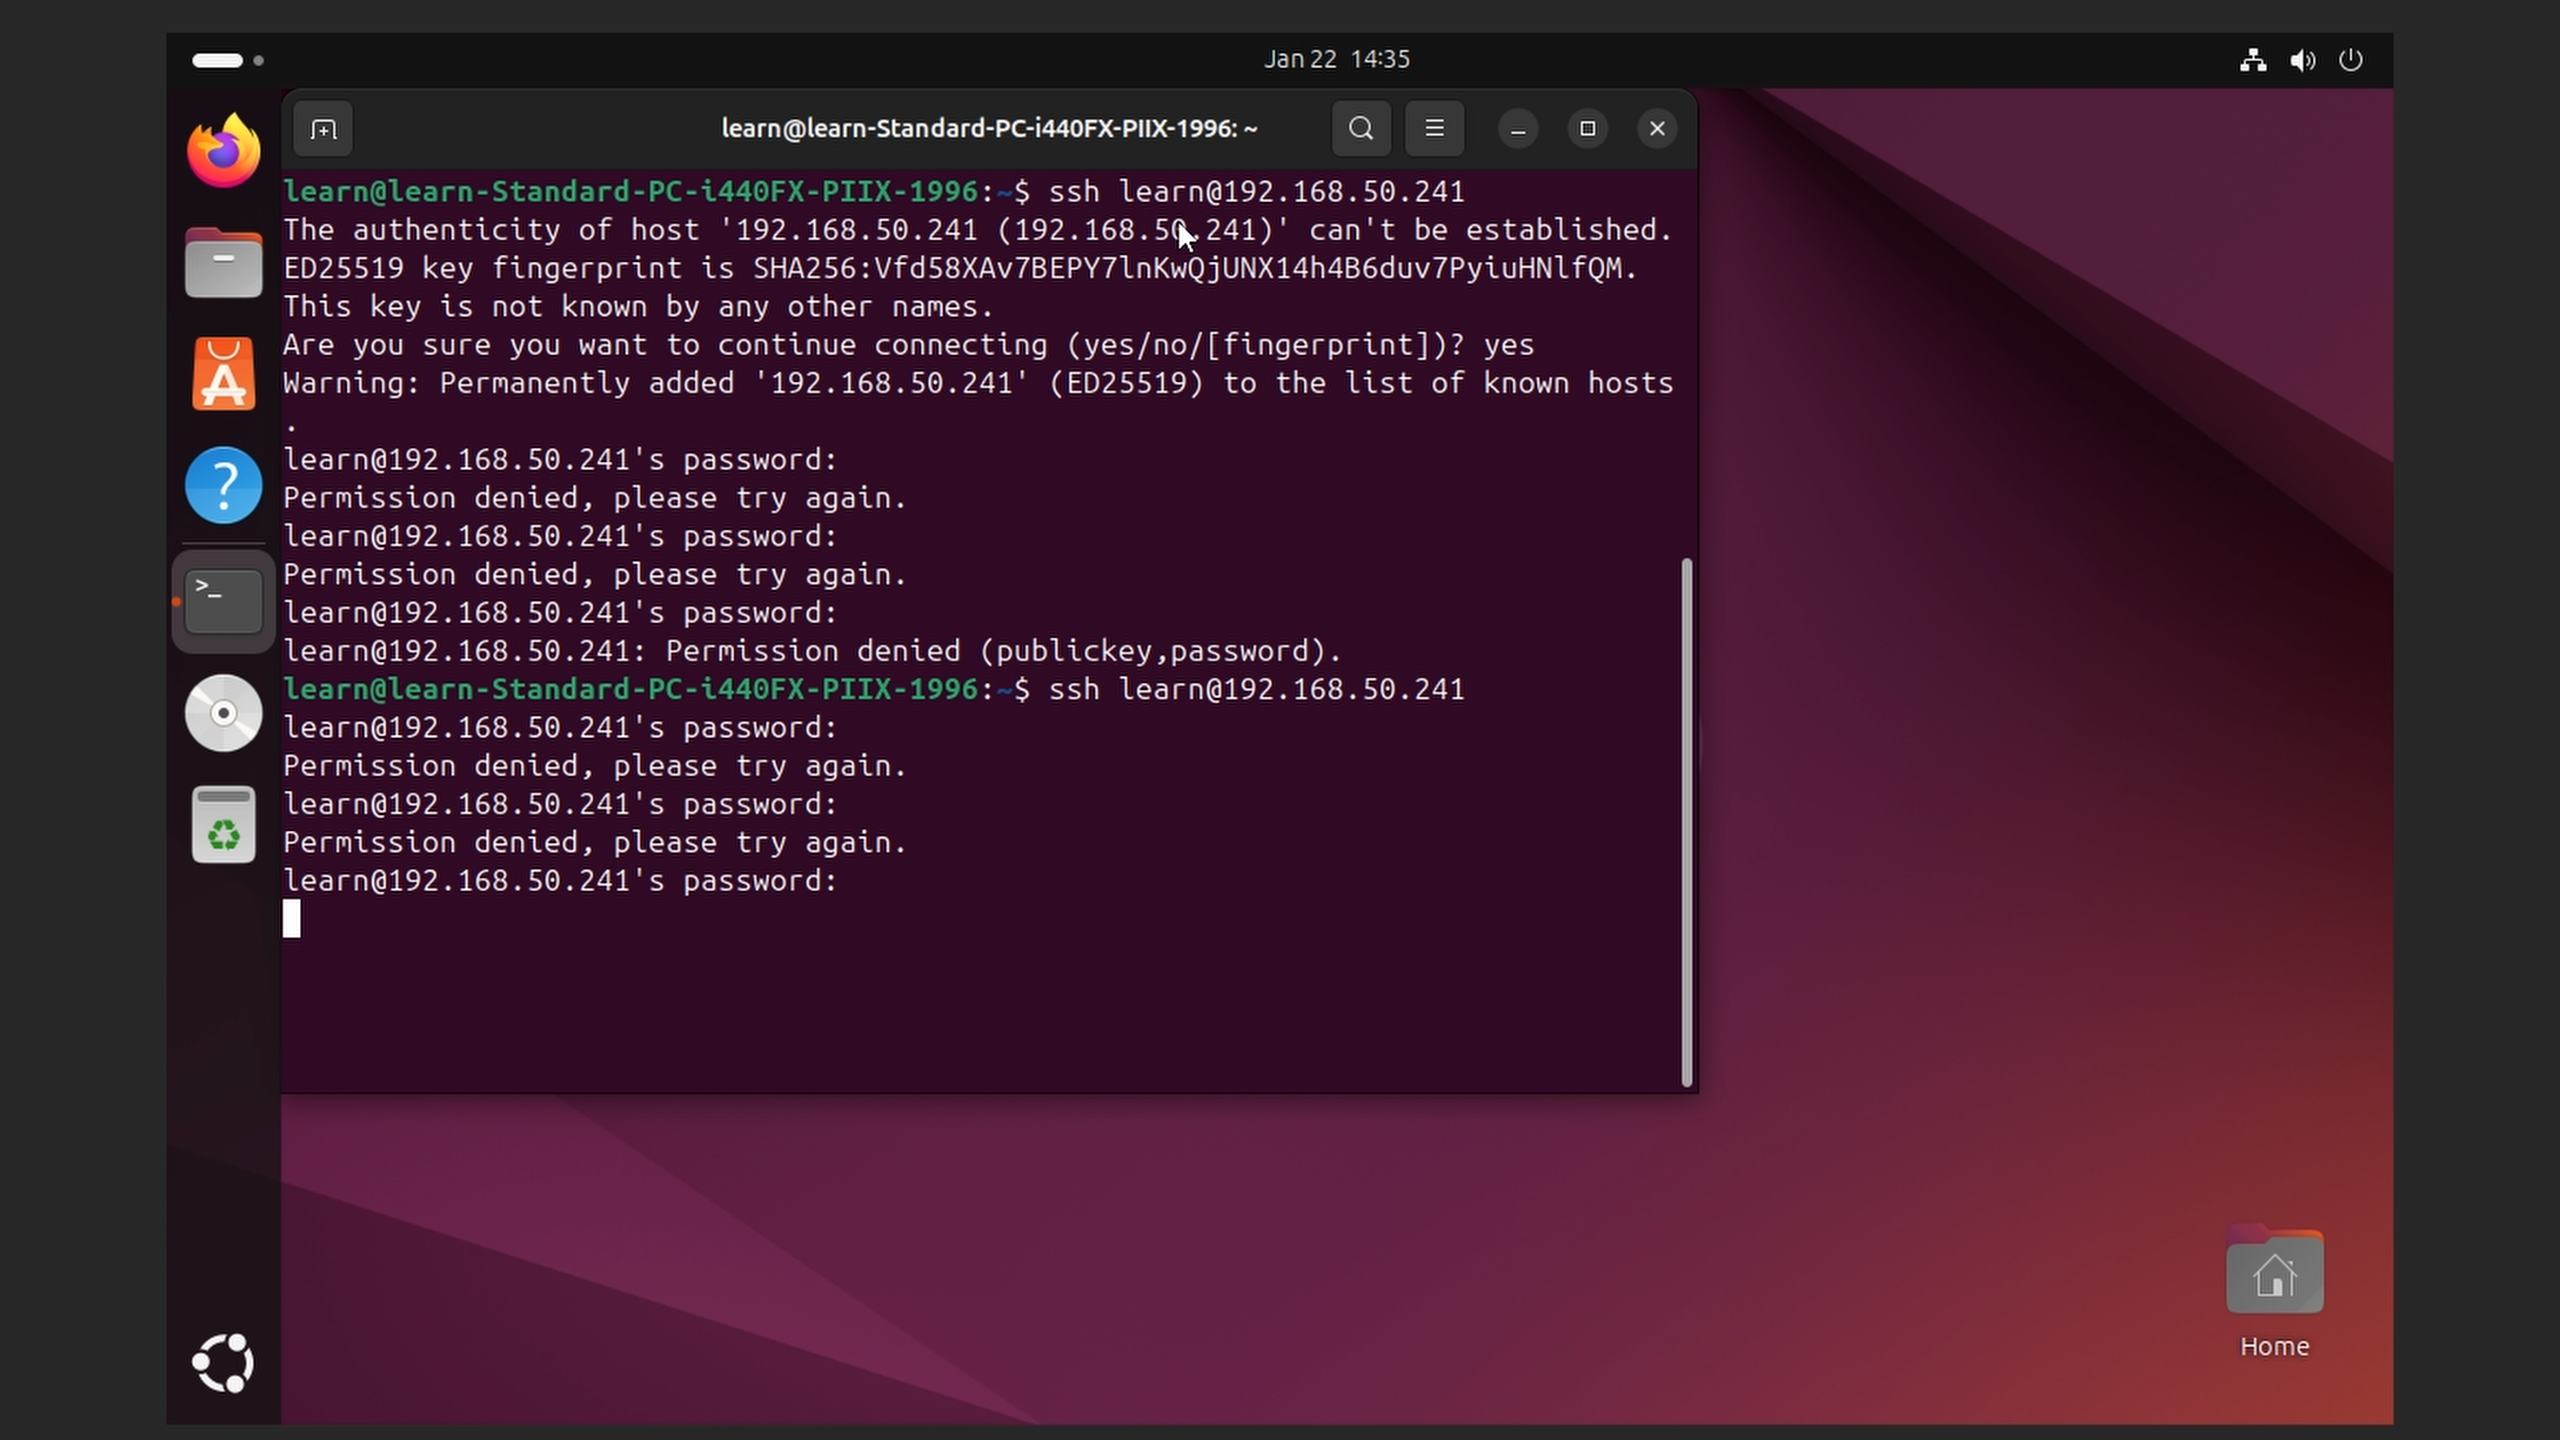
Testing that our agent works and is indexing
We are going to text that the agent is indexing by doing one of the concept guides (failed login attempts over SSH). I logged into my Ubuntu VM and failed to login to the machine with the Wazuh agent installed on it numerous times (Wazuh will create an index if three failed attempts happen within an hour).
Going back to the discovery page I can search for this failed SSH authentication event because Wazuhs documentation shows the event code to be "5760".
We can see we get a list of responses due to the incident, we can also verify the device by checking the hostname field.
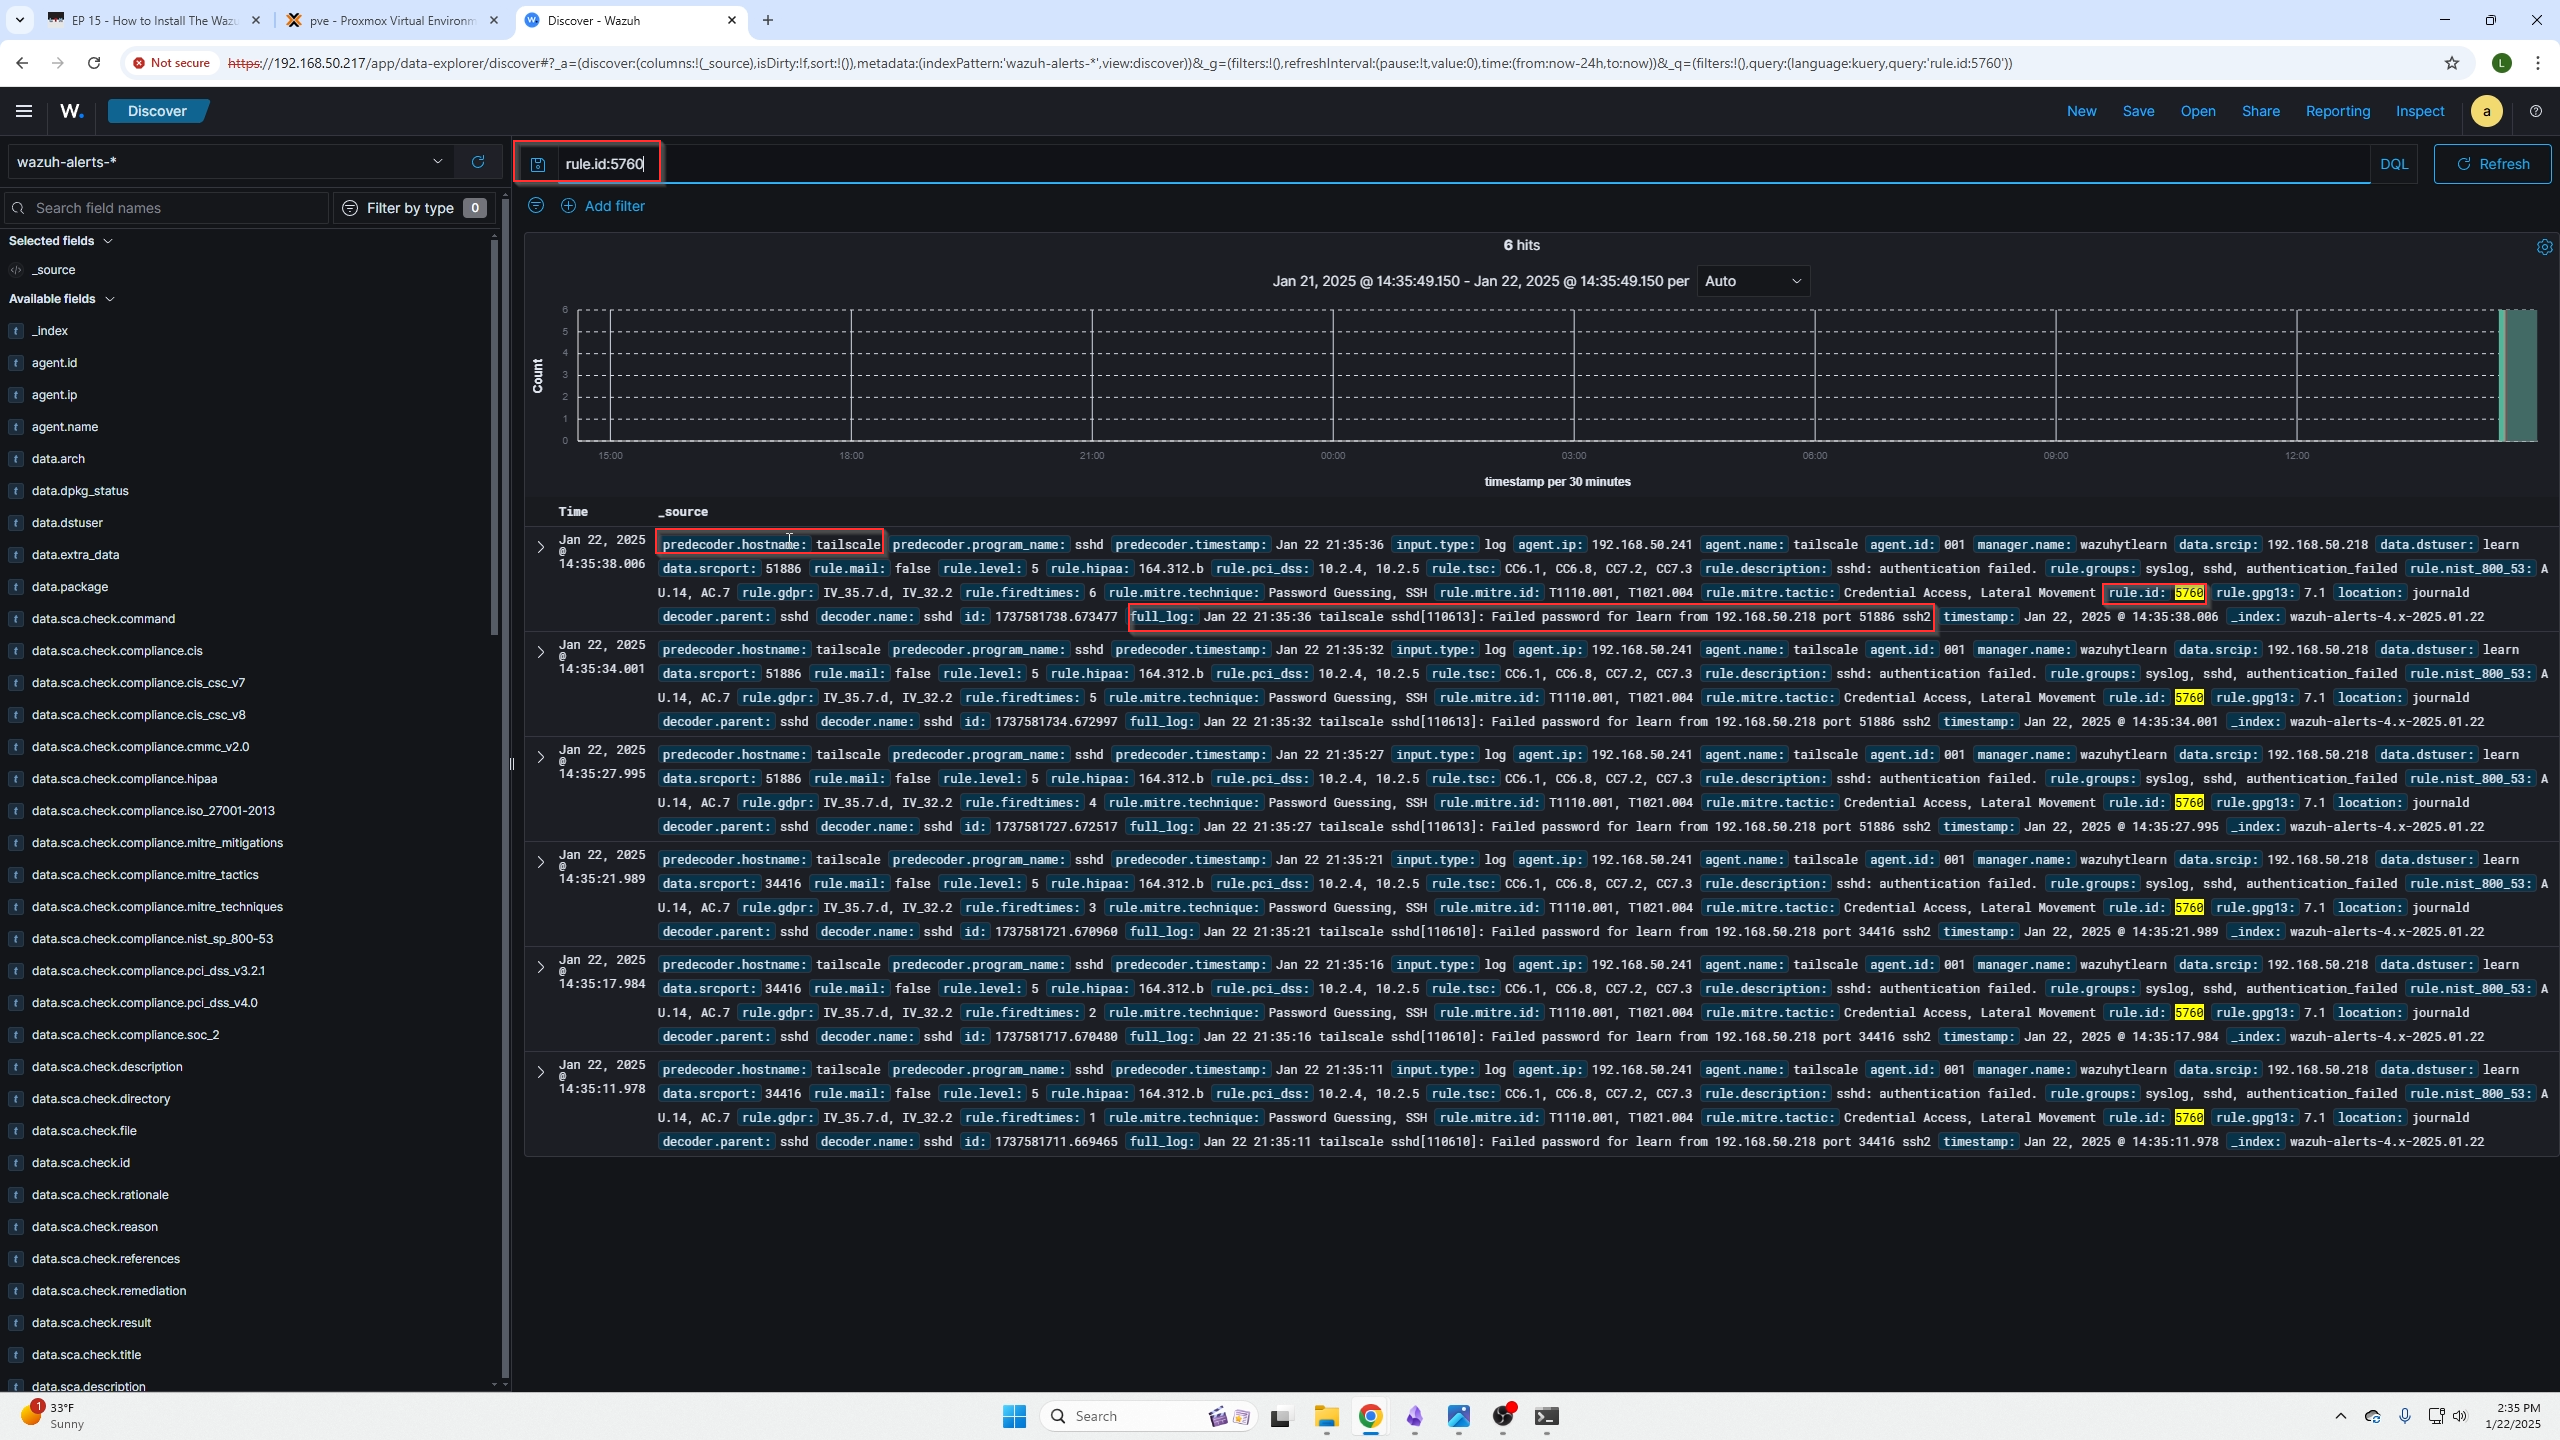
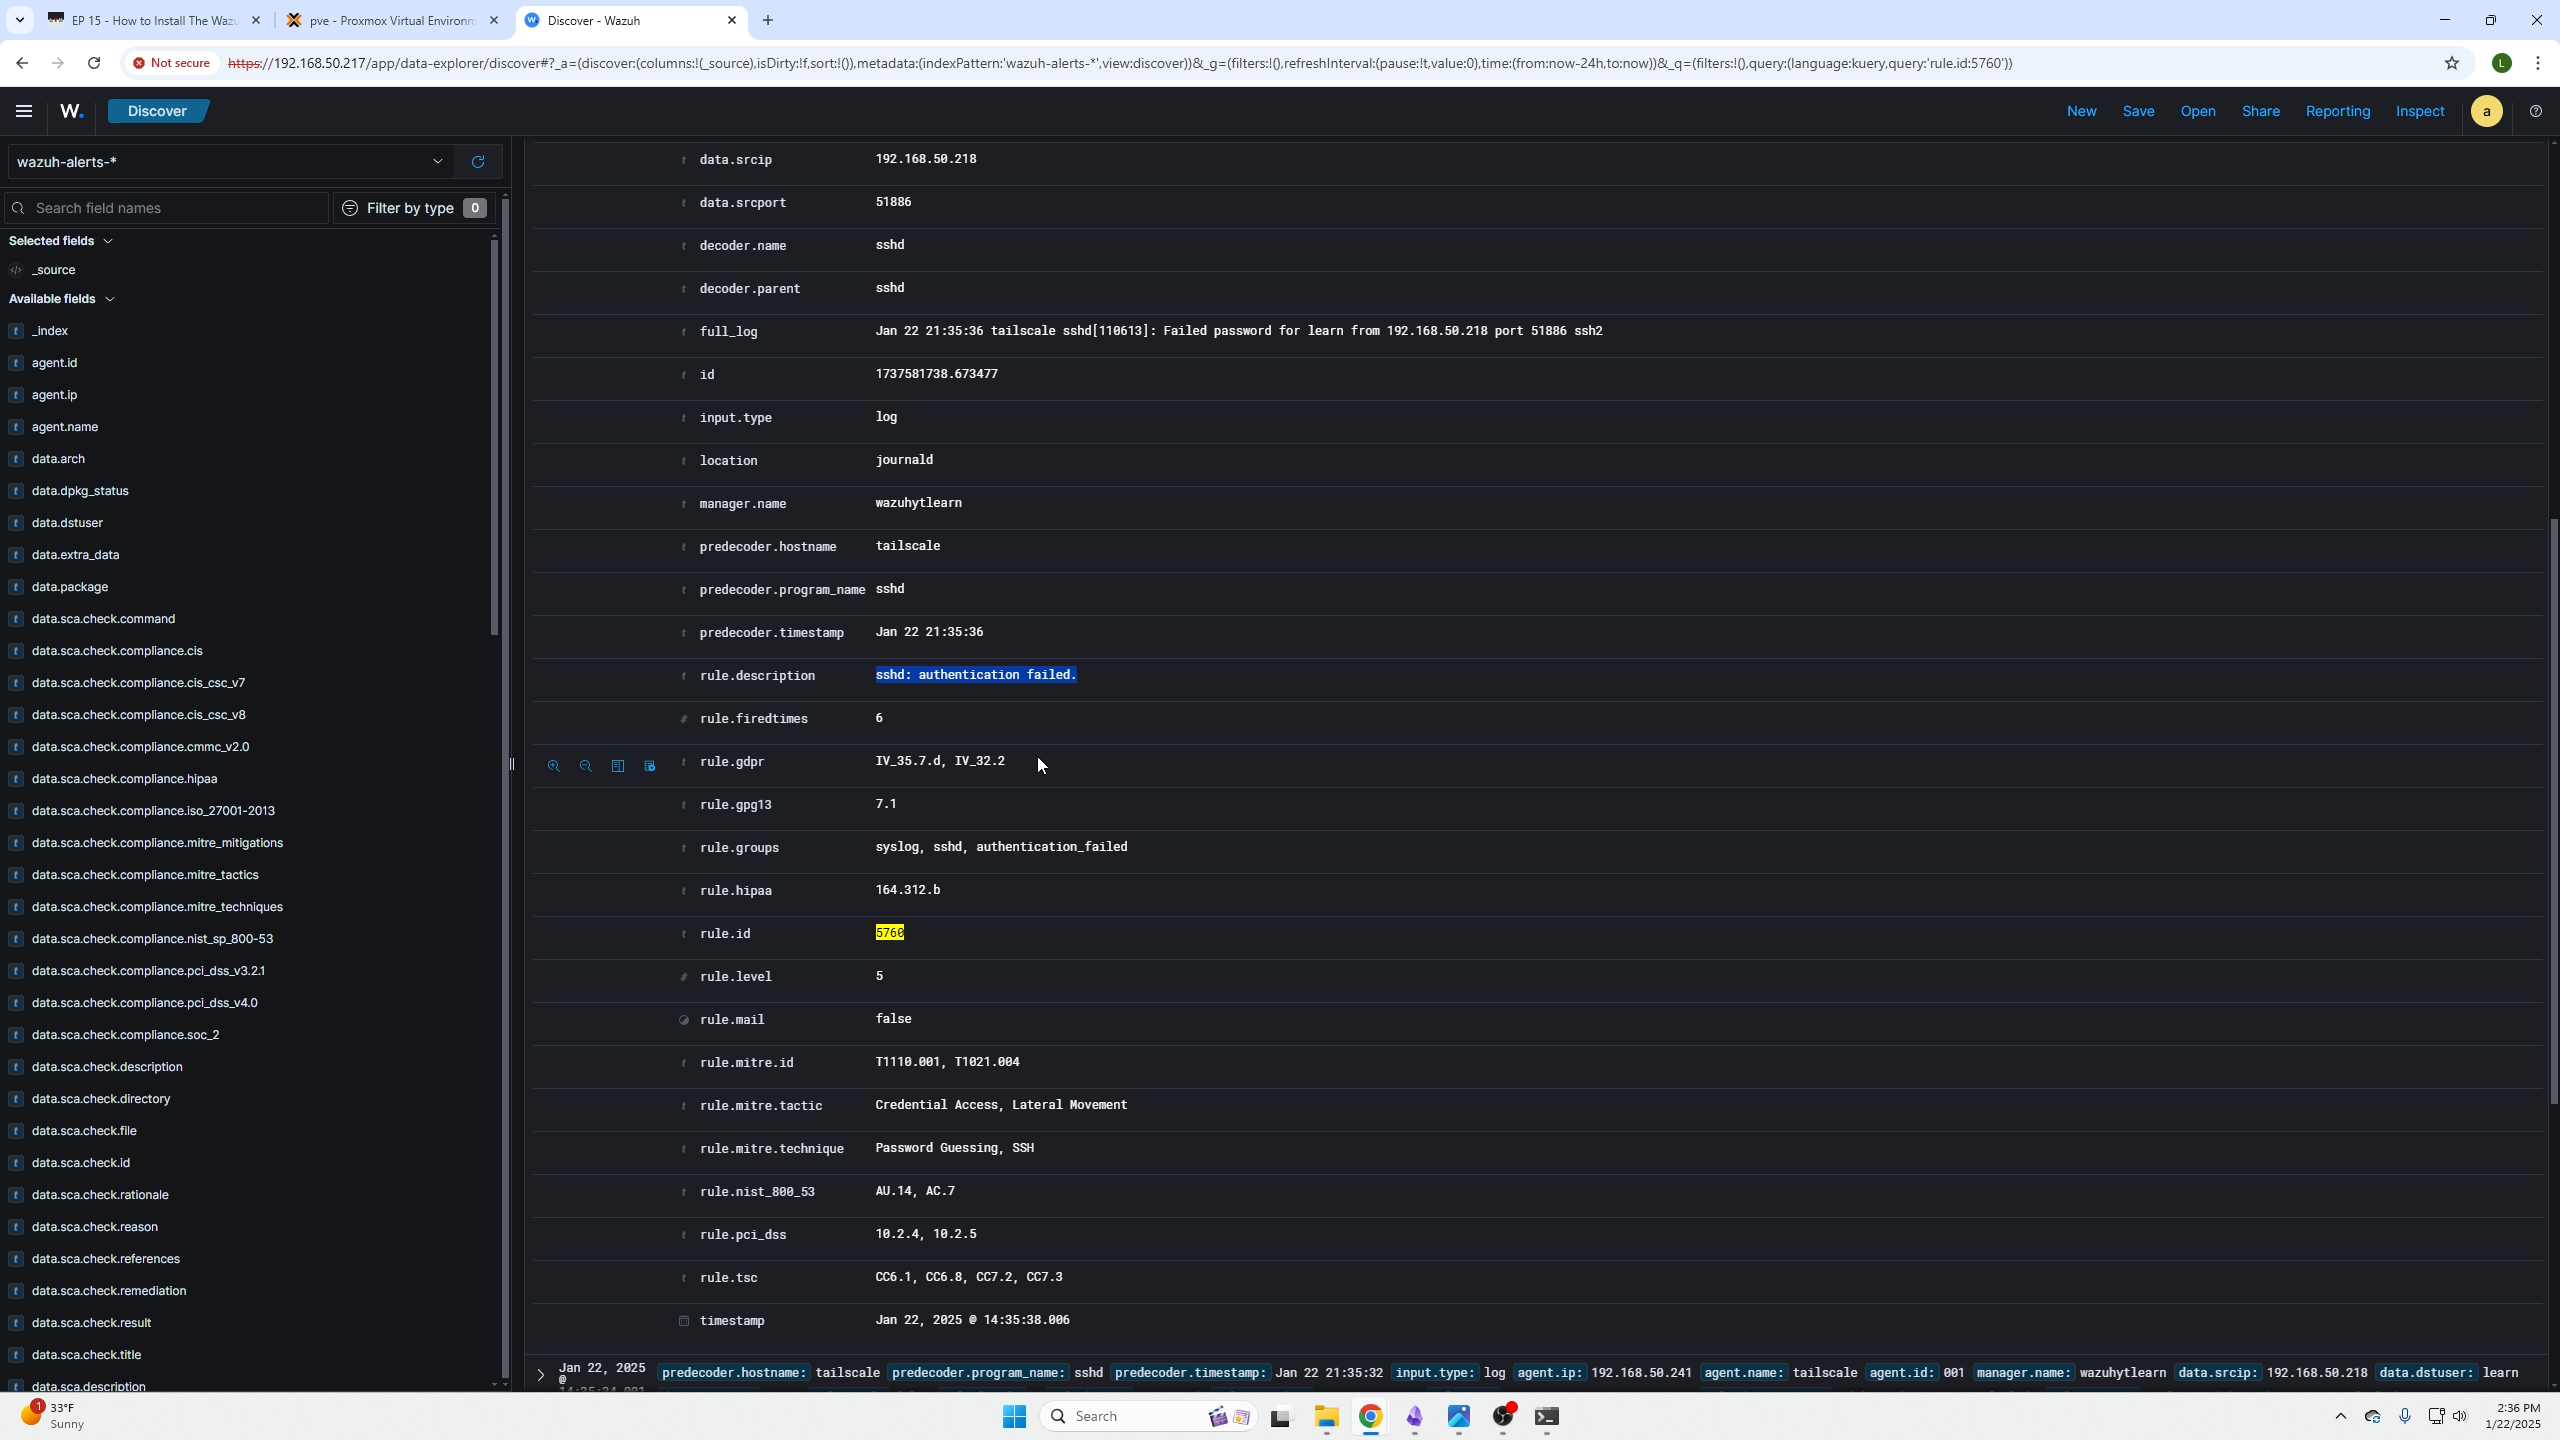
You can click on any event if you are unsure what it is and read the rule description or full log fields to get a better idea.
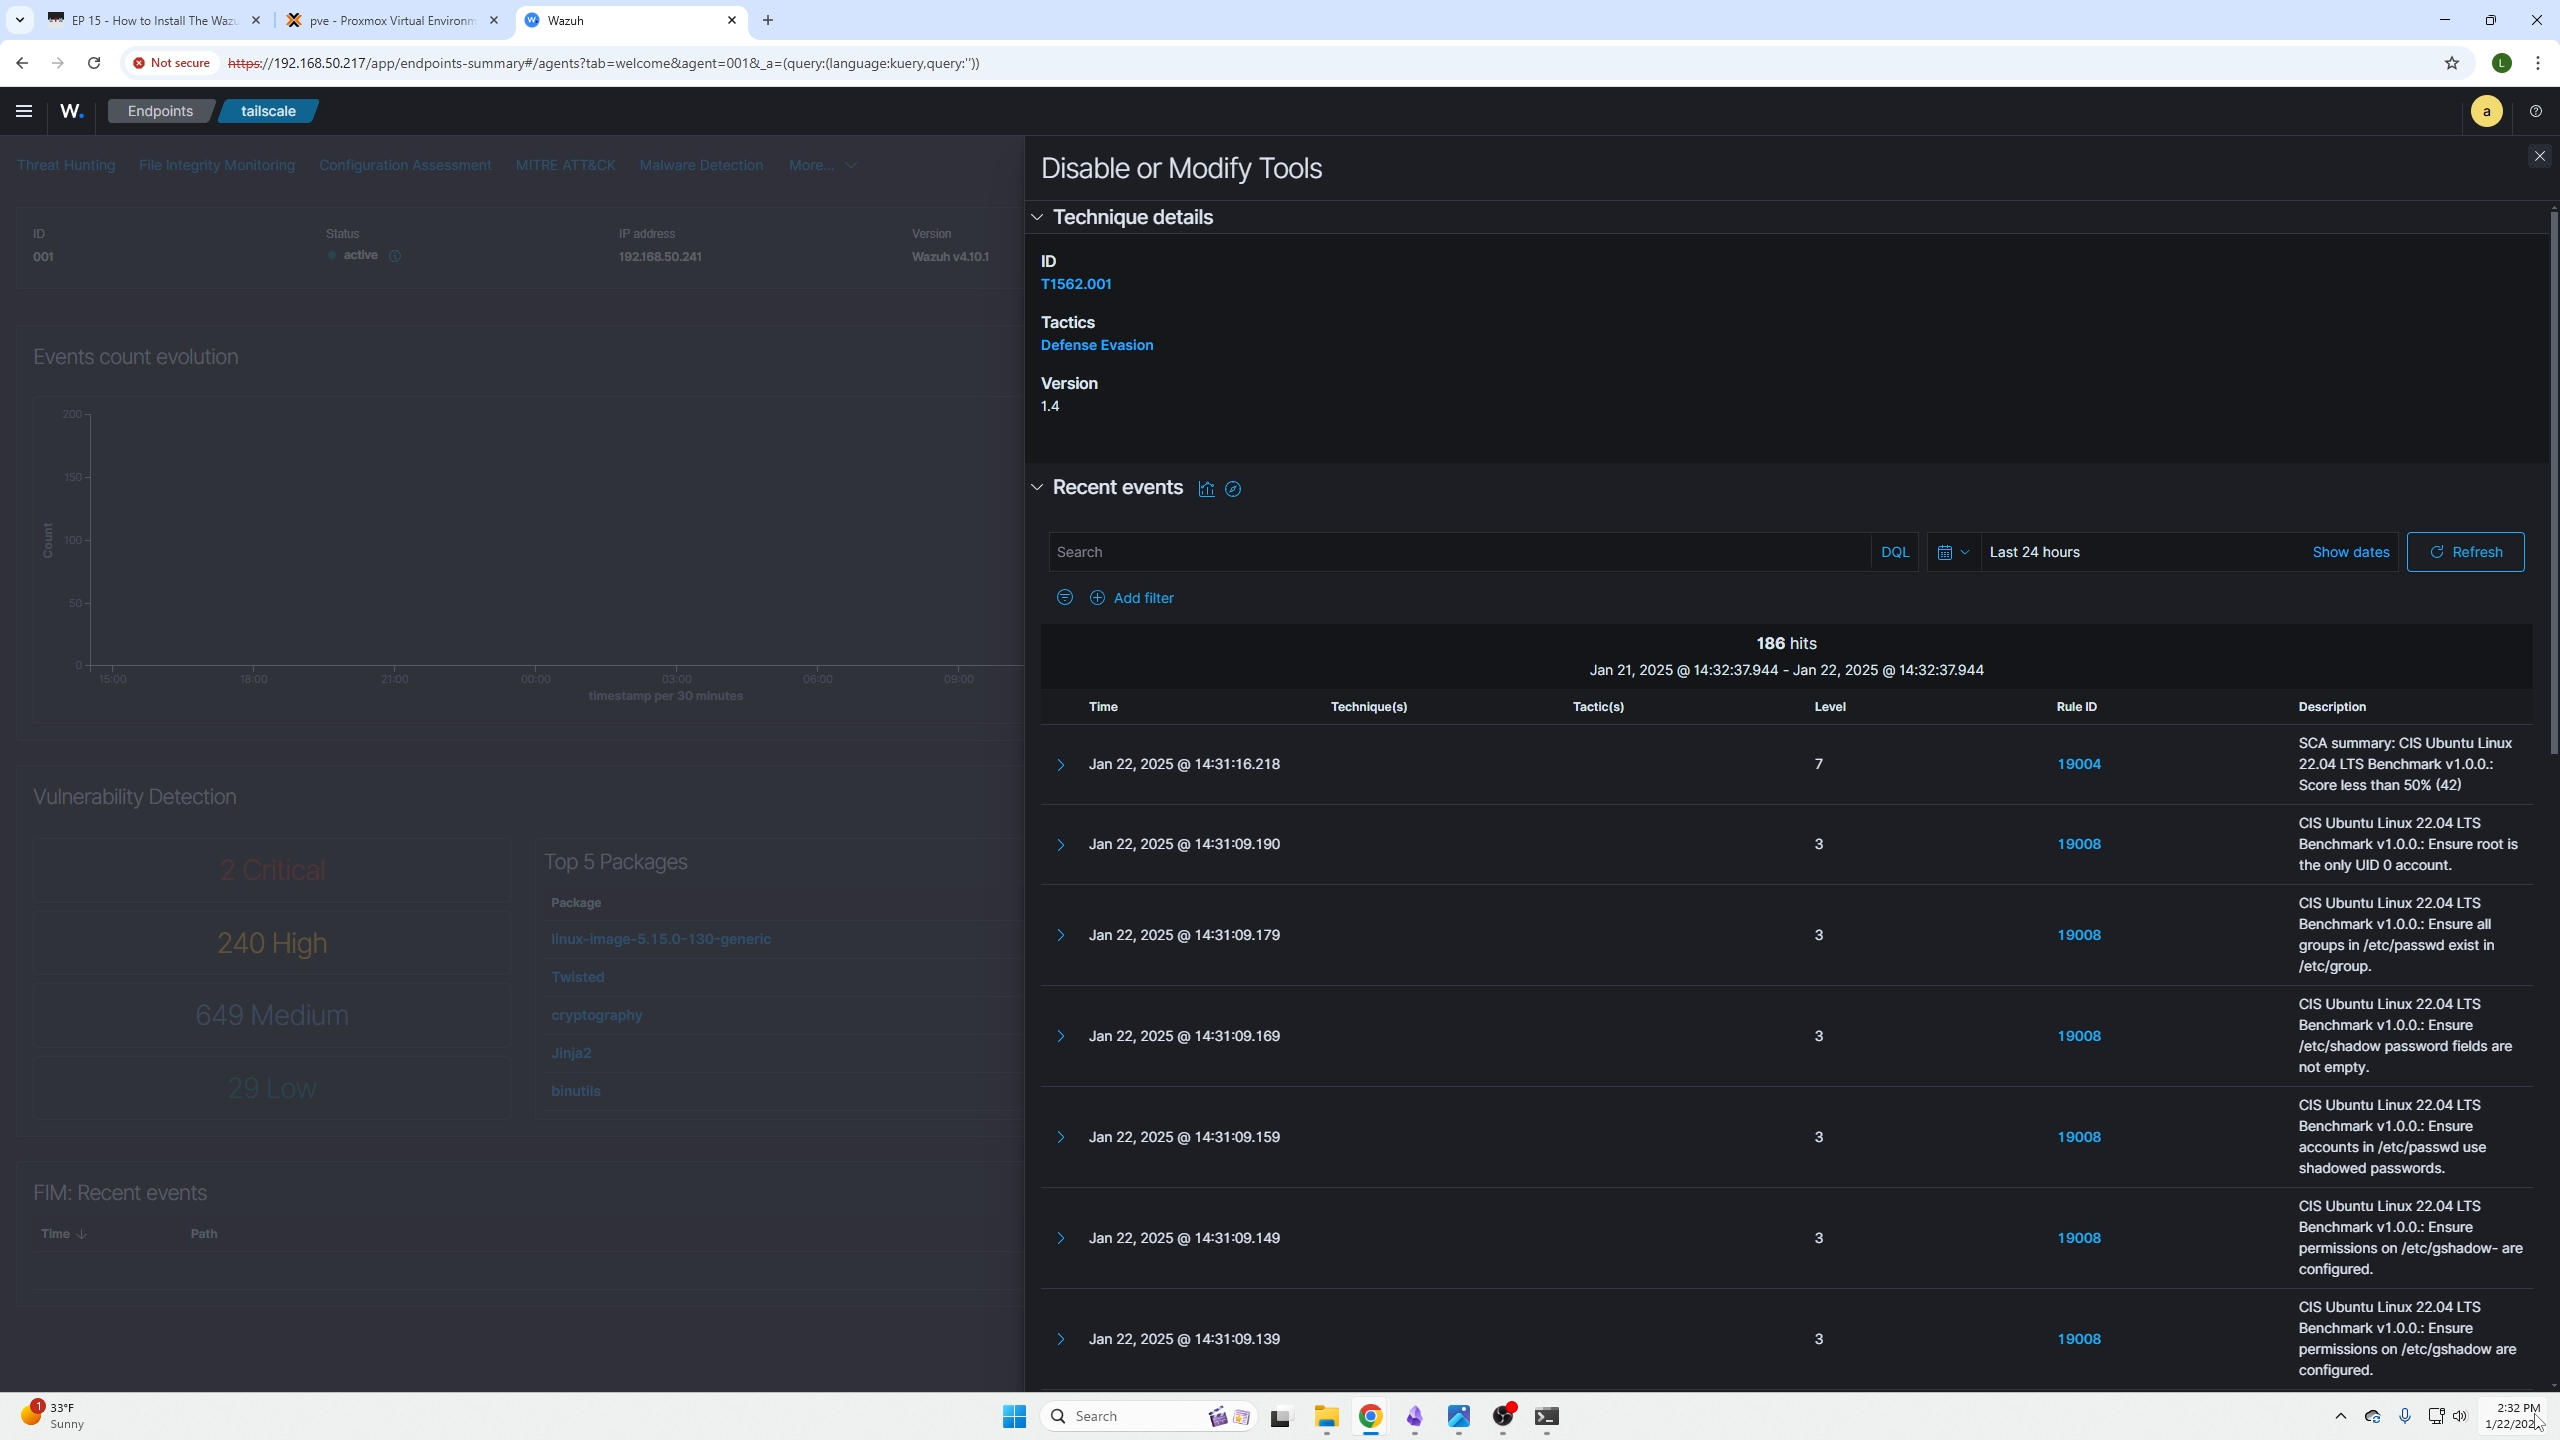
Checking events by the host
We can also check for events on a single host by going back to the main dashboard / selecting that agents are / clicking the agent we want / and being presented with the following screen again.
Then you can select the sections based on what incidents have occurred on your device. In our case we can now see their is a credential access option that wasn't there before.
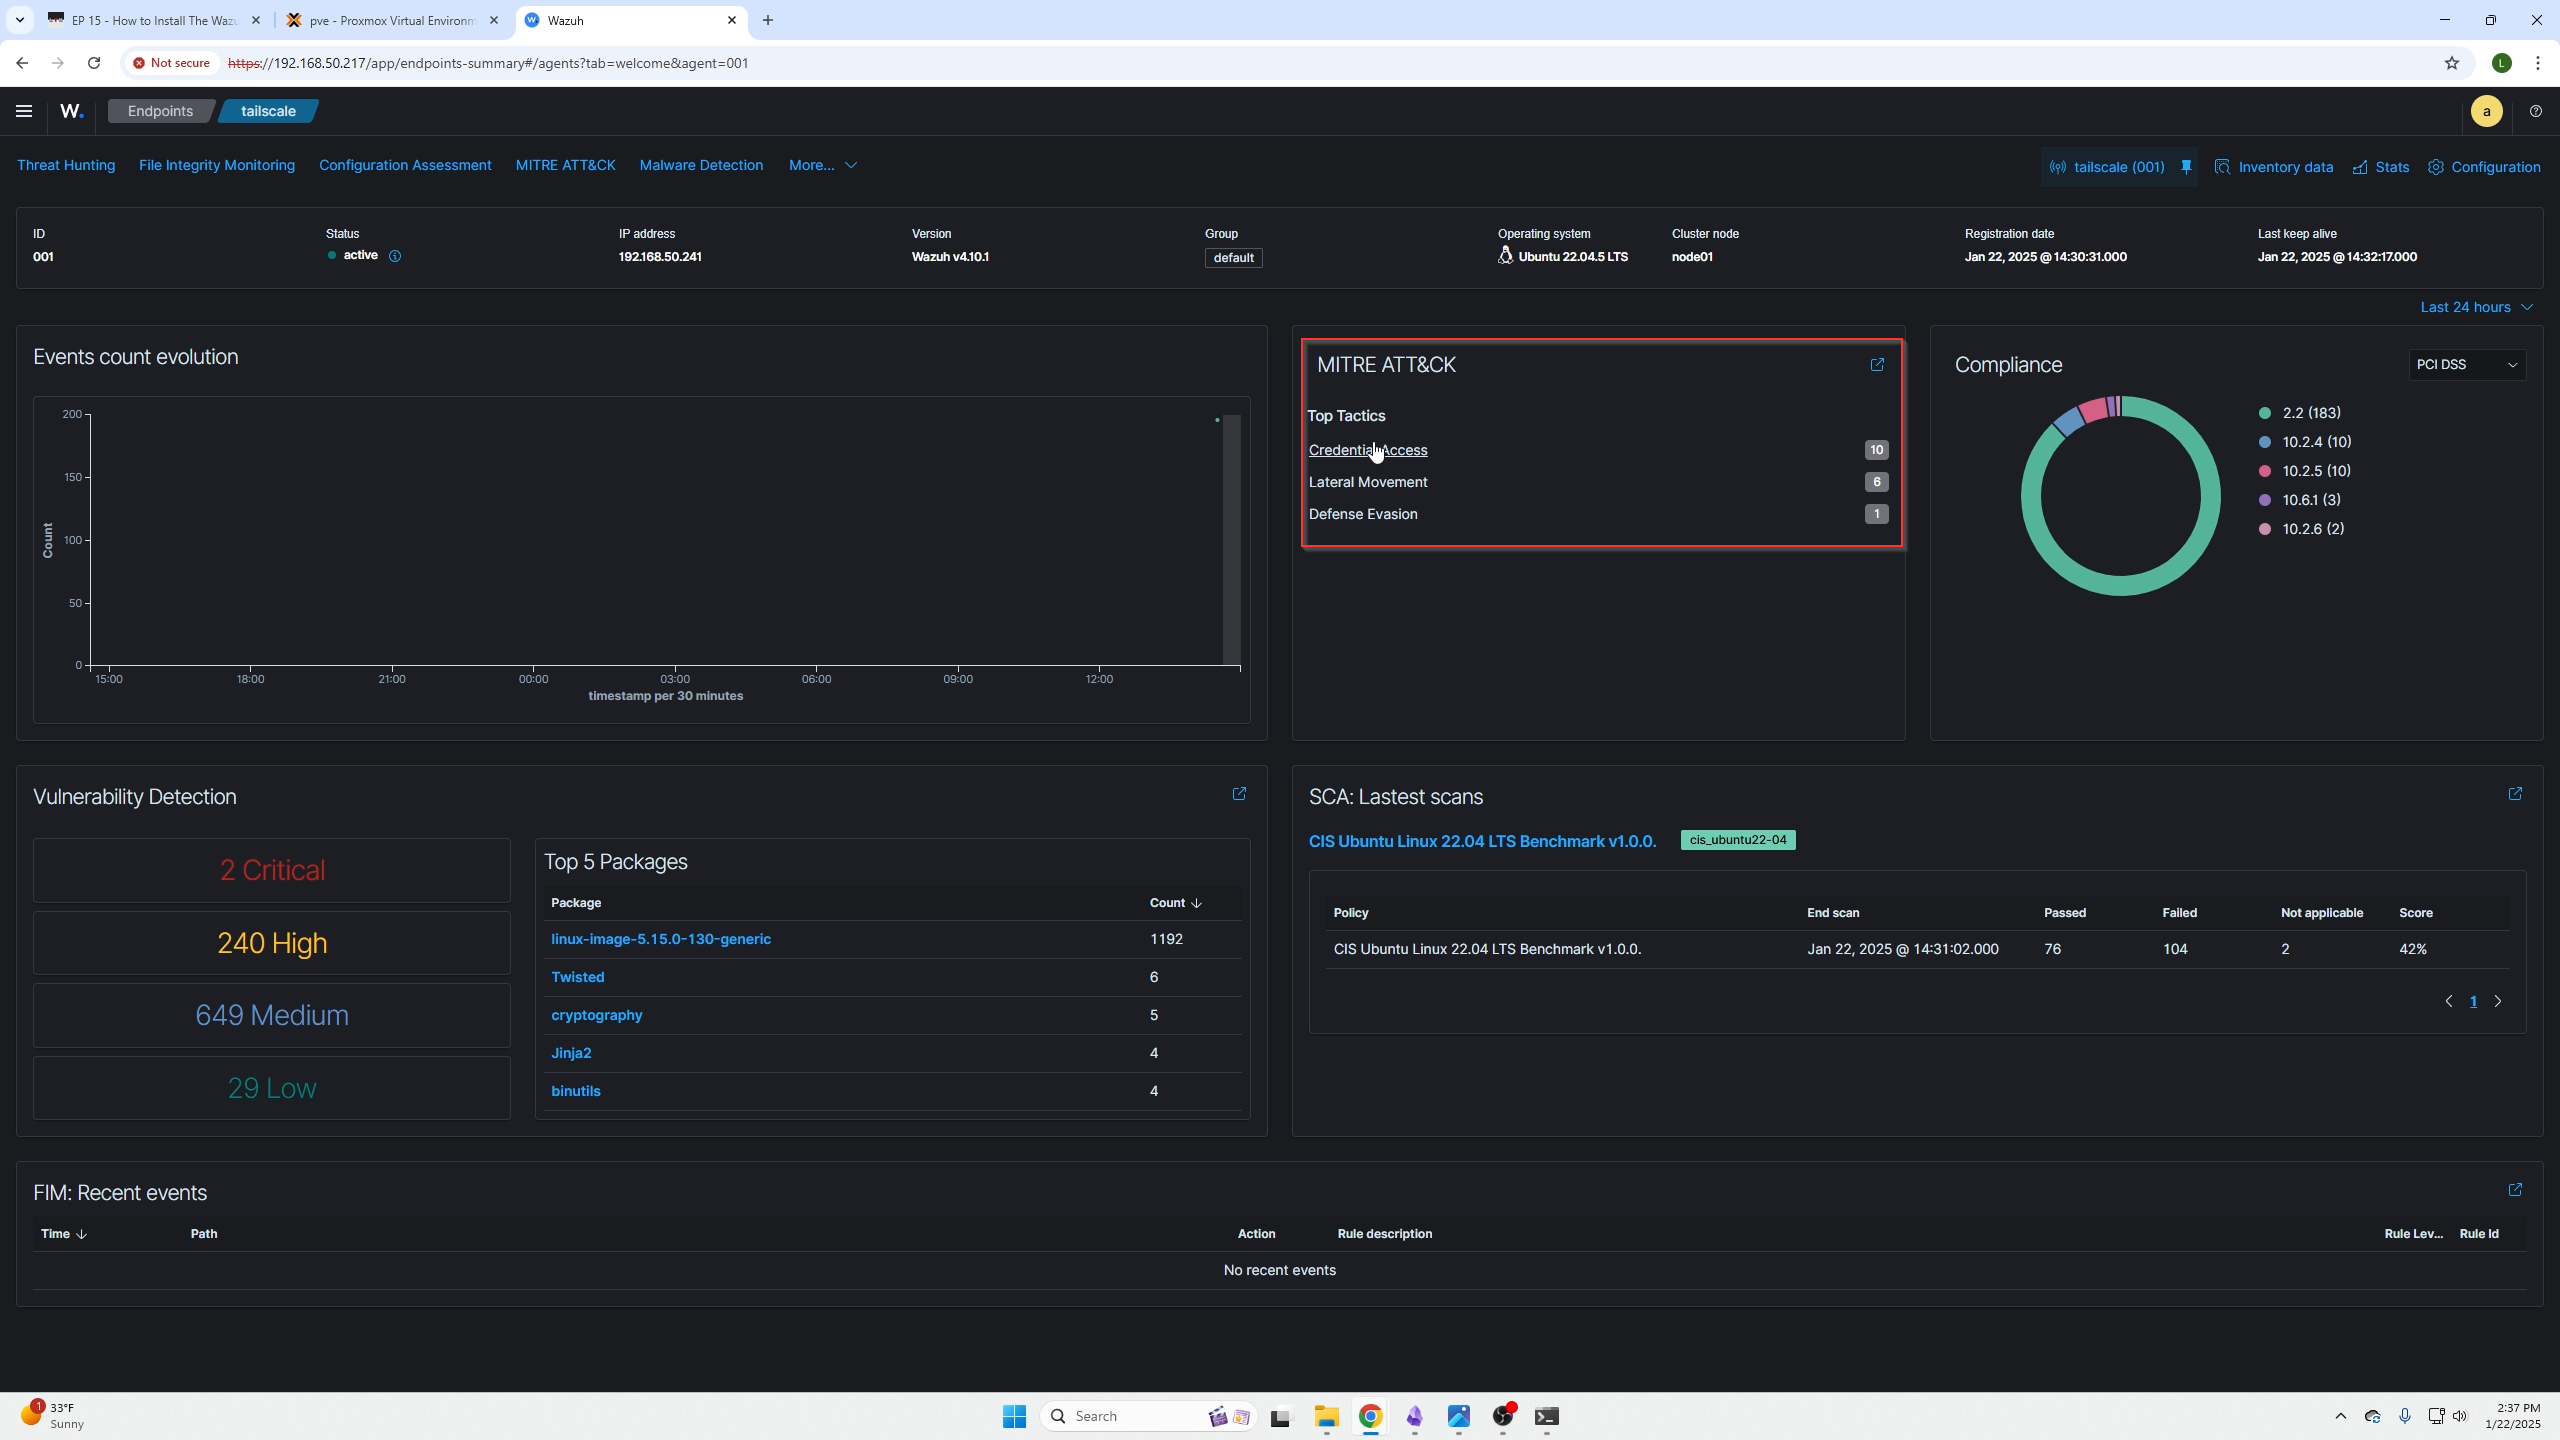
You can read about the incident here just like the discovery page, the advantage here is its only showing events for a specific type and a specific host where the discovery page shows everything (this can be useful if you are unsure what you are looking for or know an event ID number. Possibly learning as well.)

Create custom dashboards to monitor events
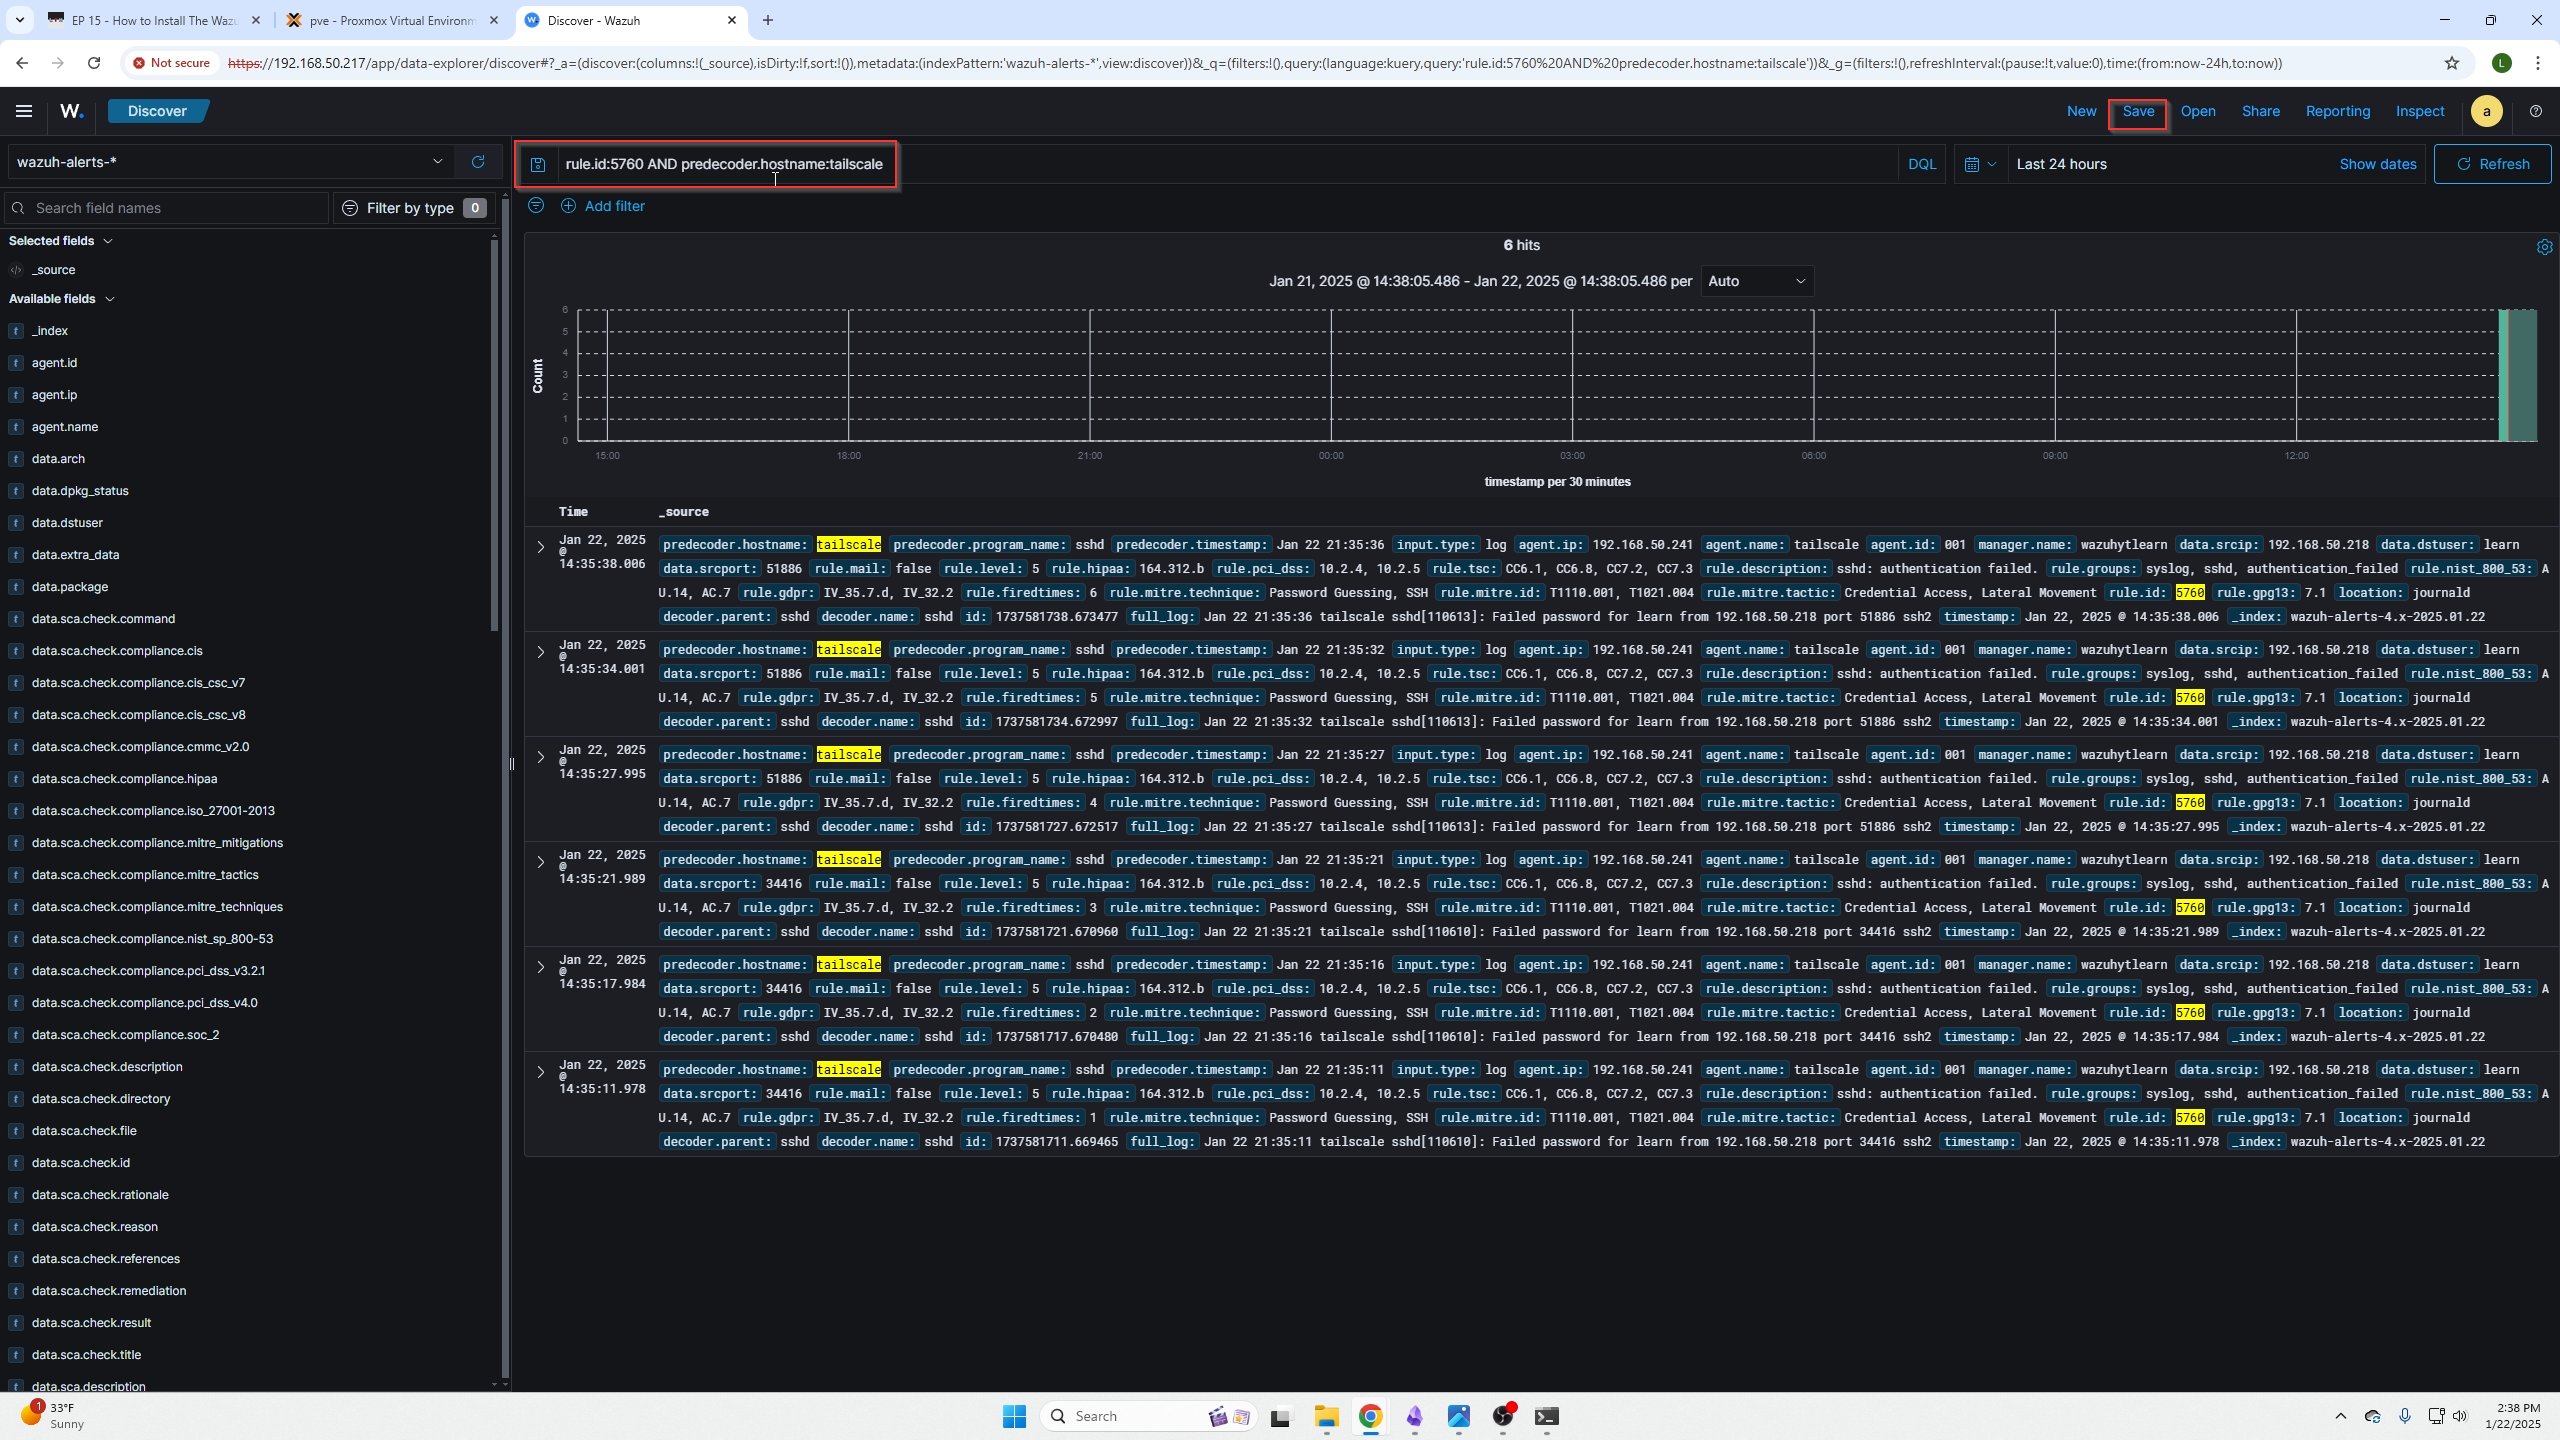
Going back to the discovery dashboard:
We can now create a search based on our findings or our now known rule IDs, etc. from investigating the host.
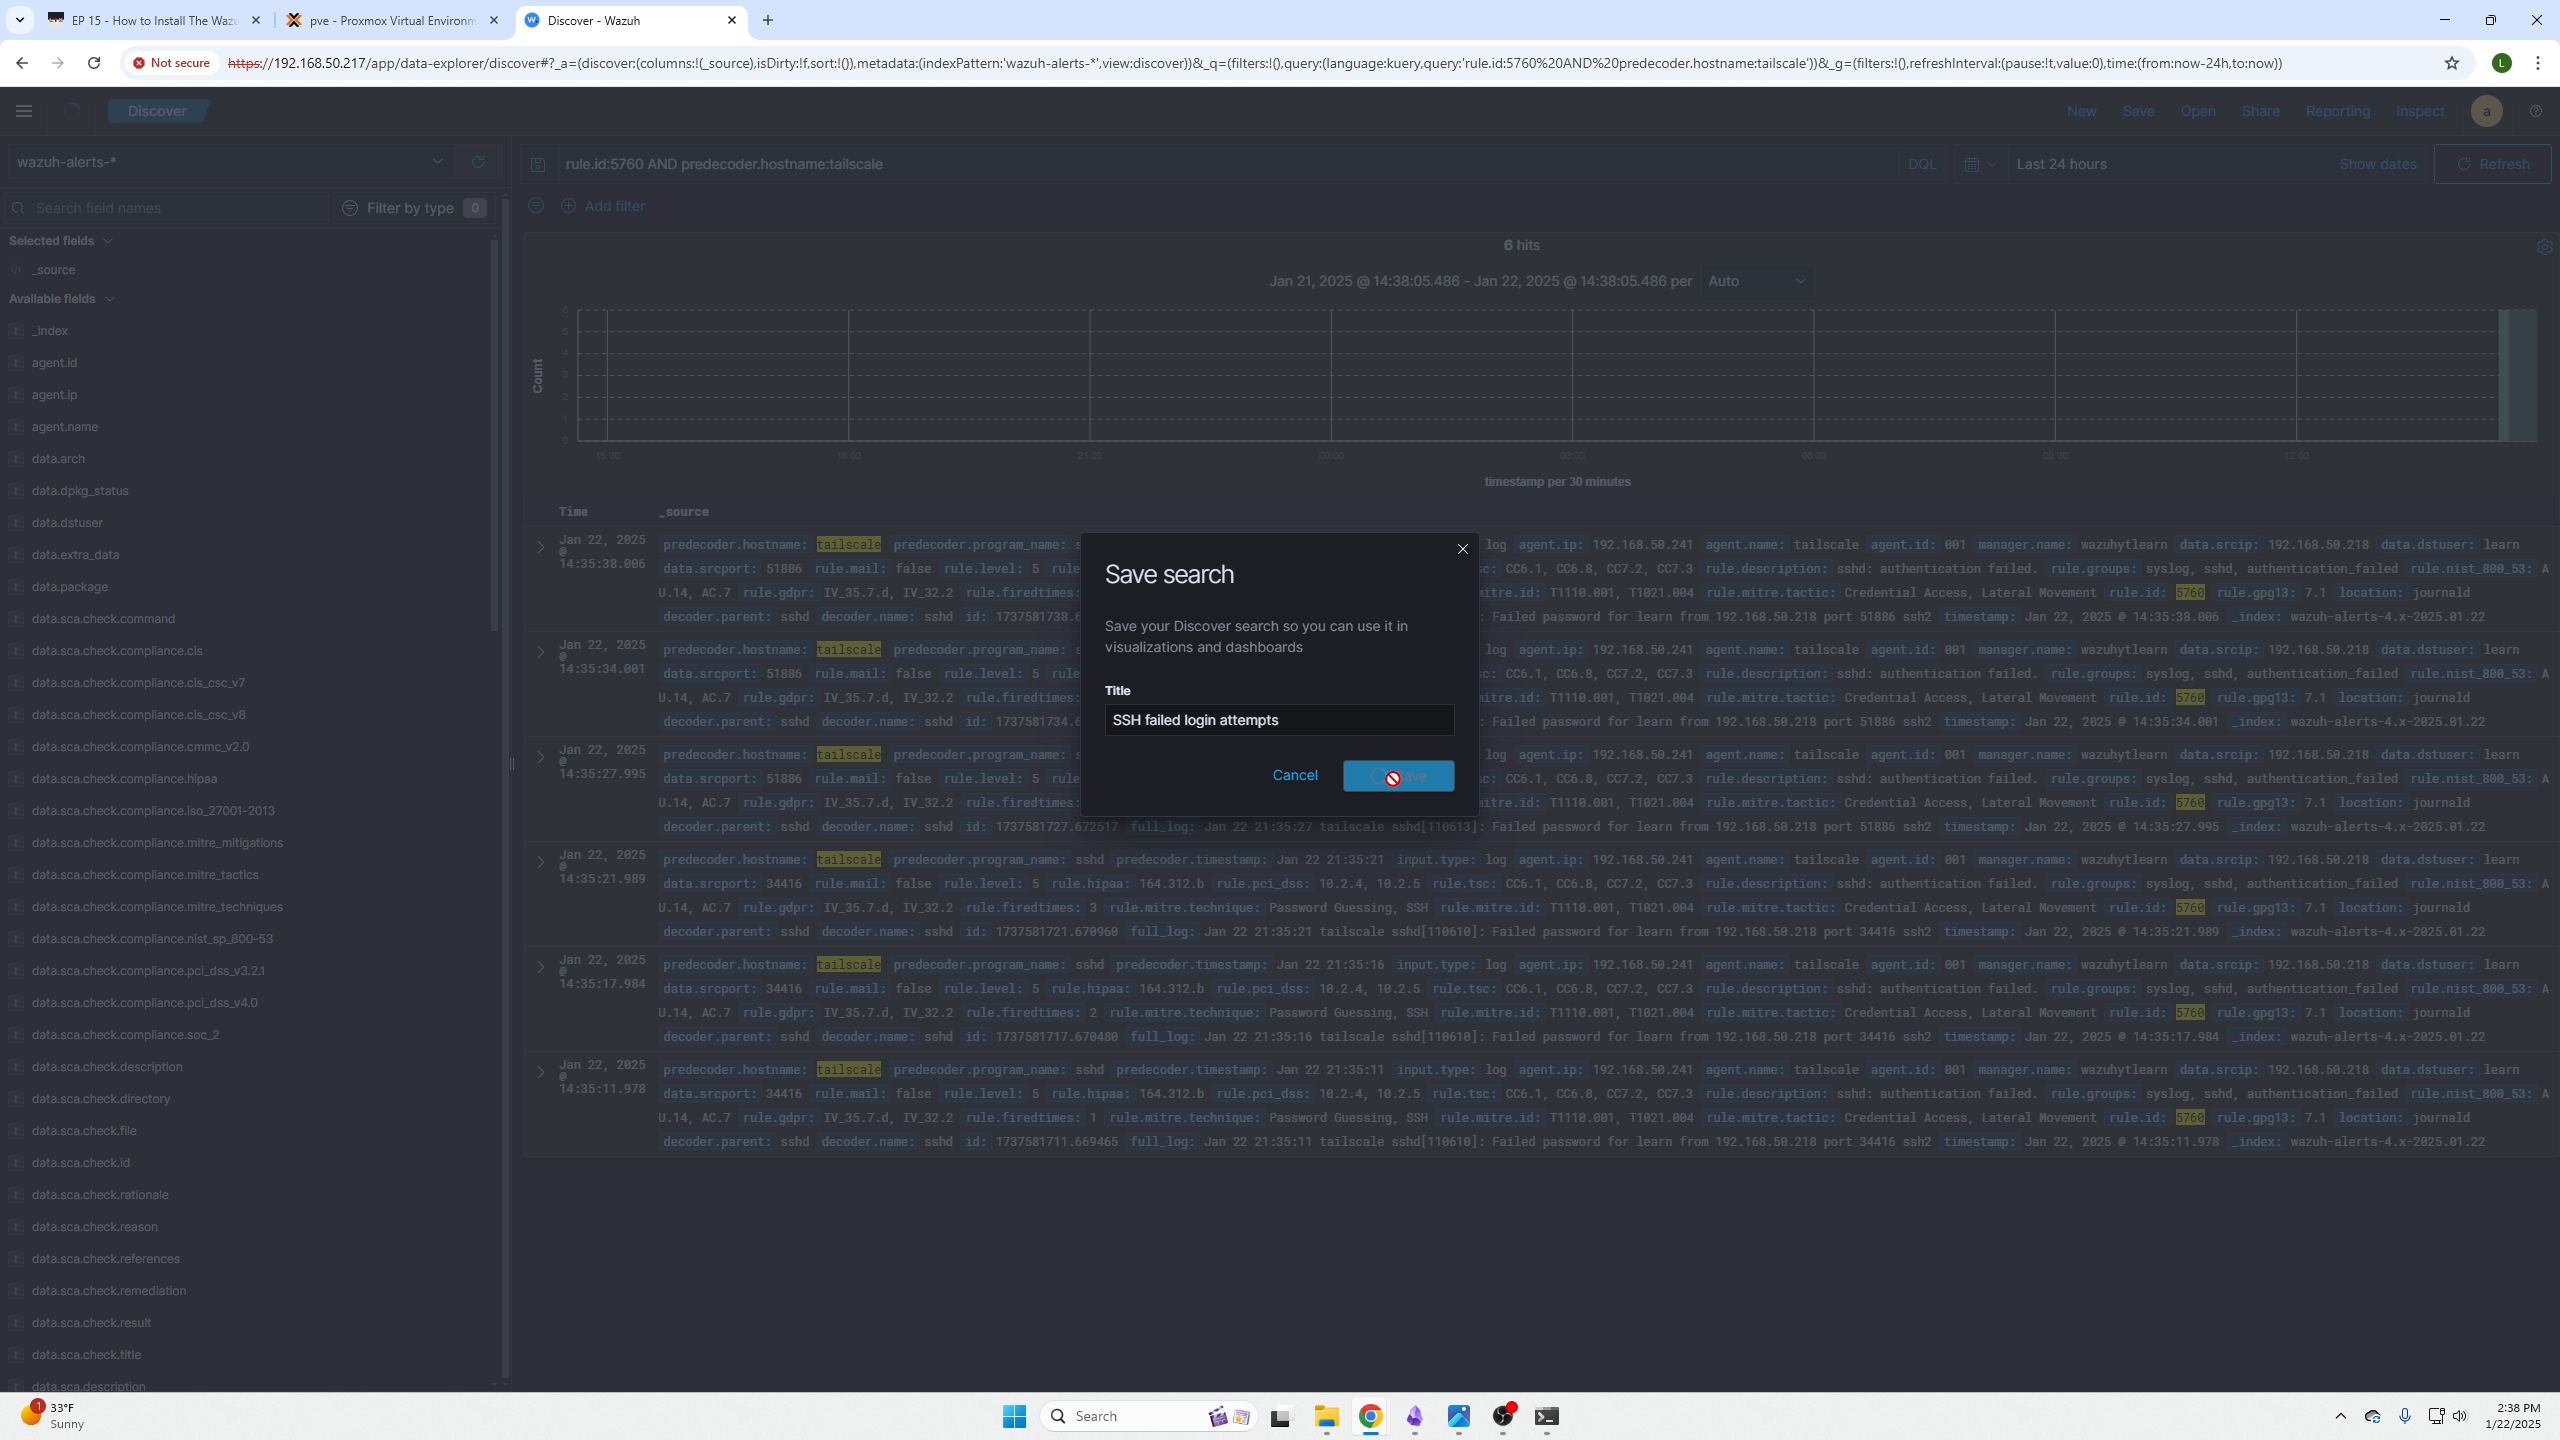
After you create the search query and it resolves what you want, click save on the top right and this will save your query so you can come back to it whenever you need and allow you to add it as a tile to a dashboard.
(The screen shown is after you selected save and named your custom query.)
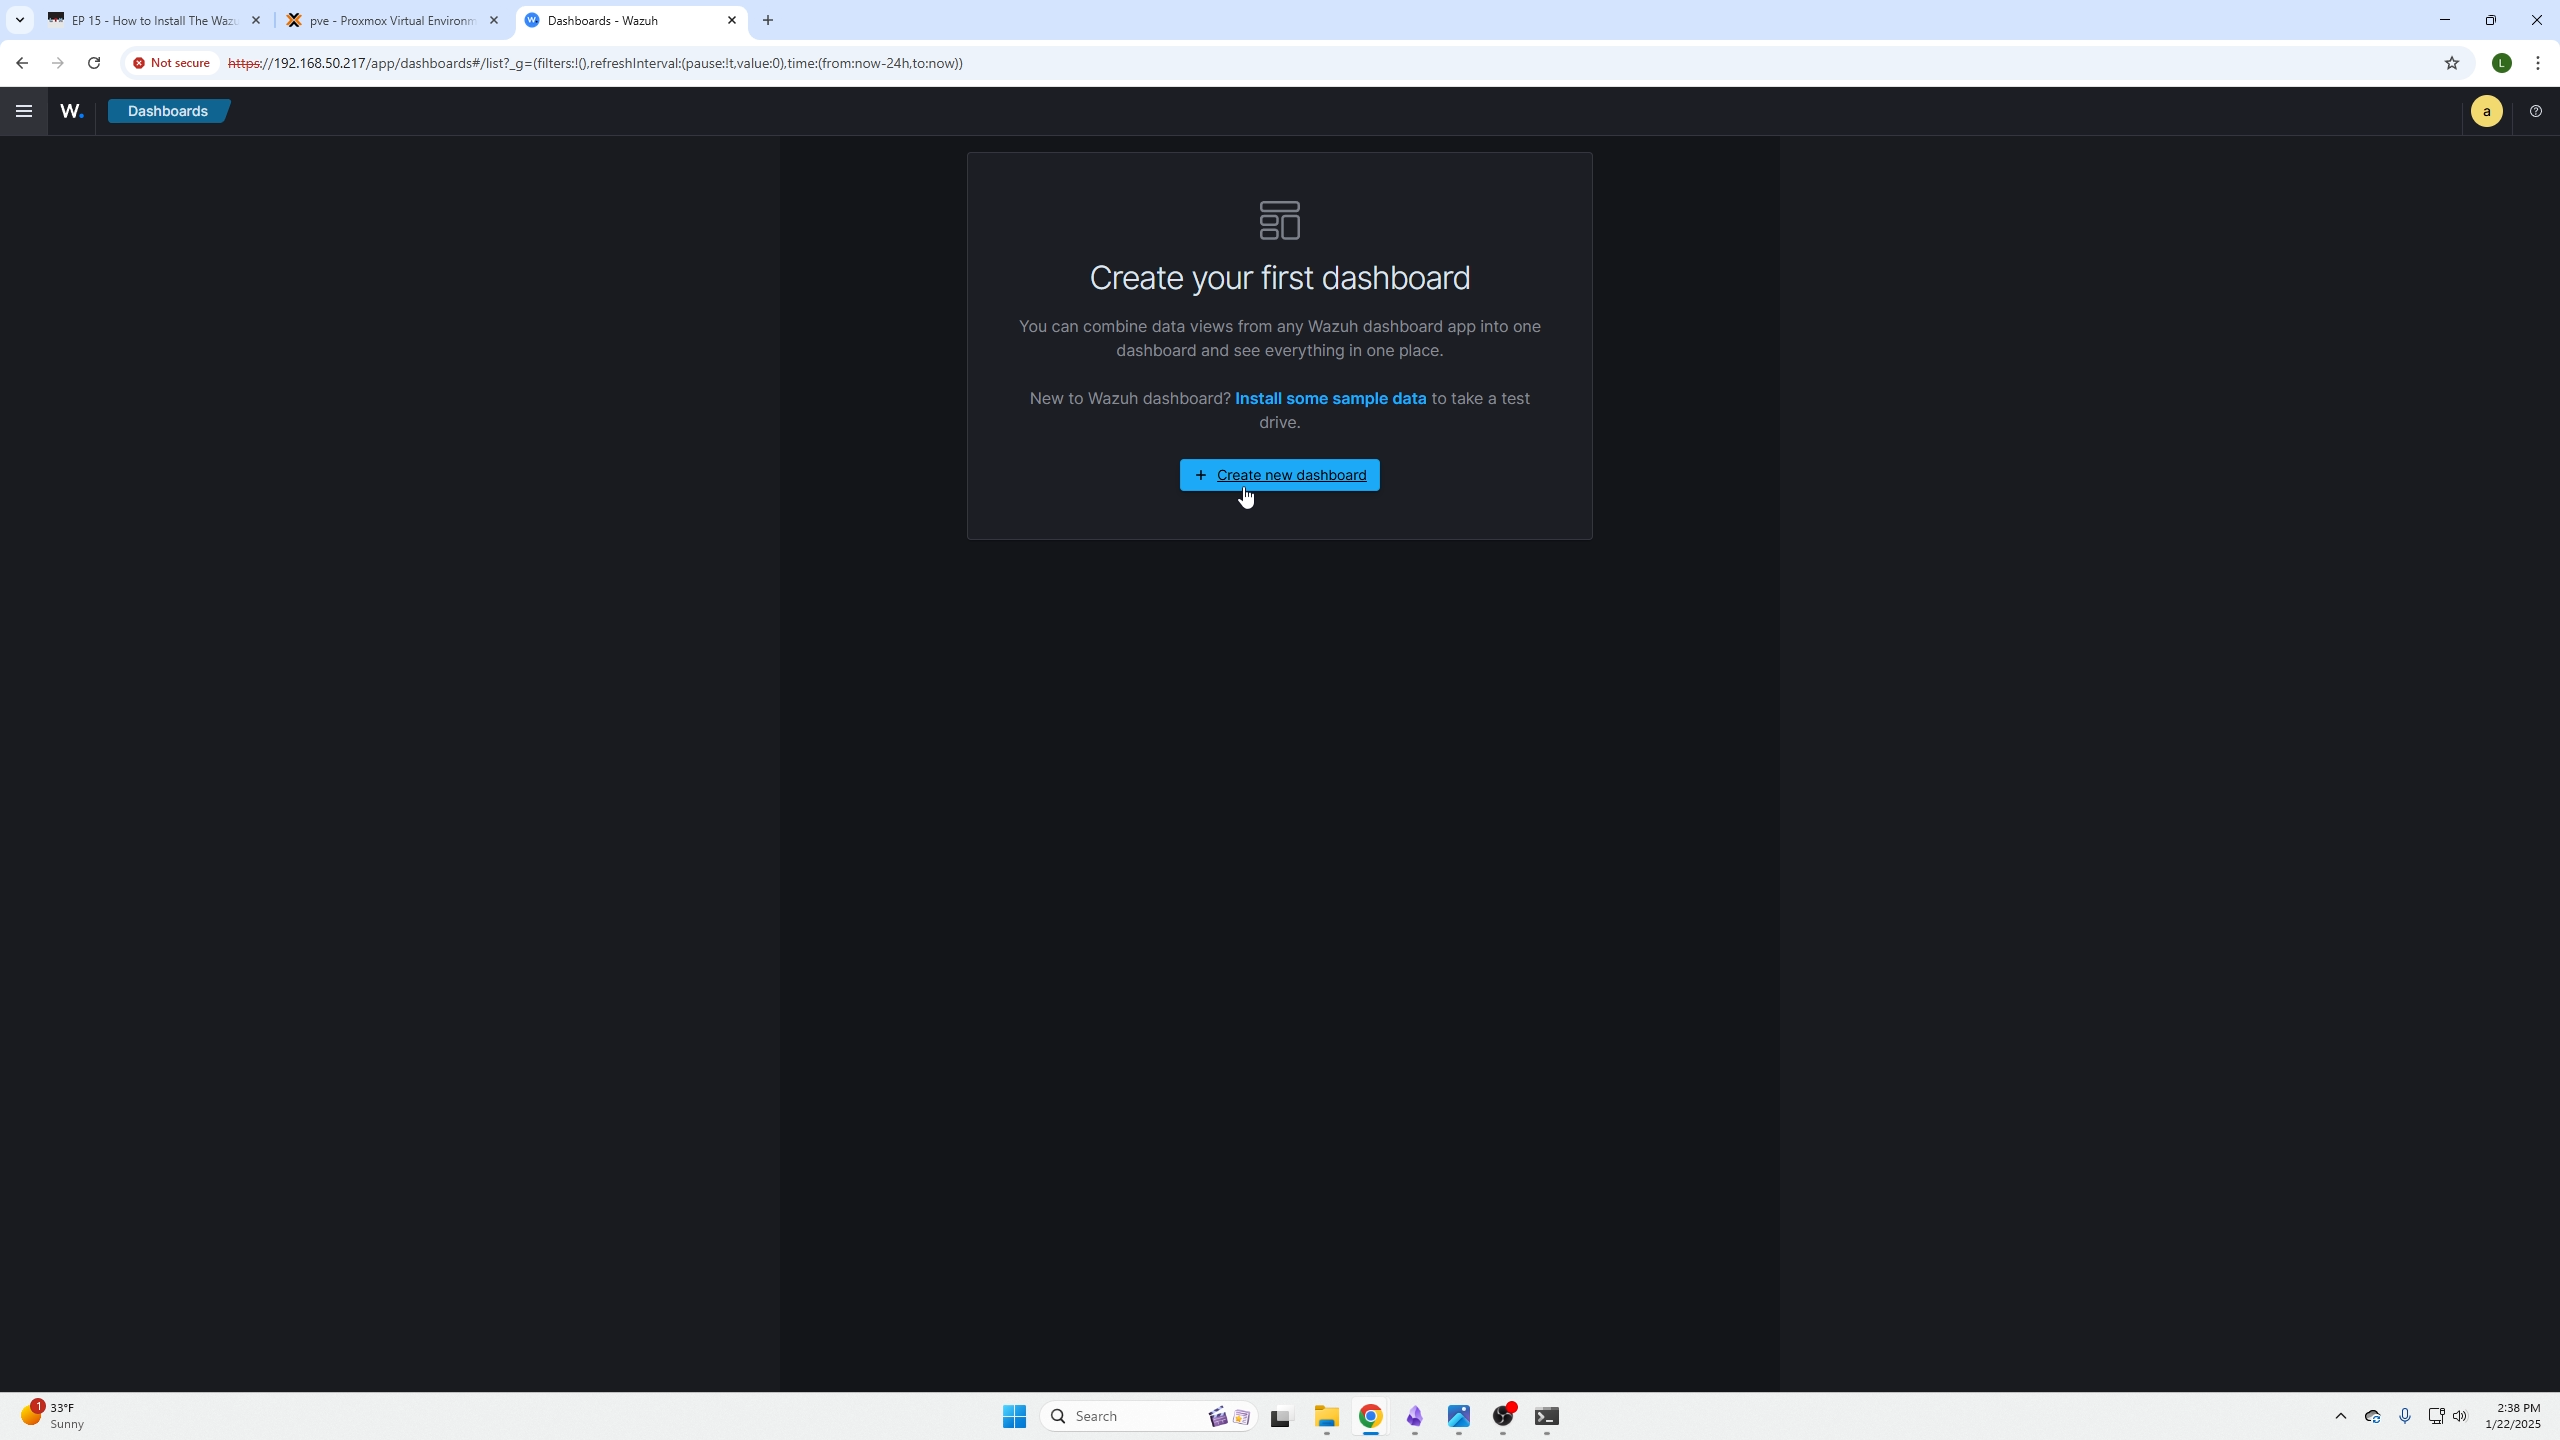
Now go over to Dashboards in the explore menu.
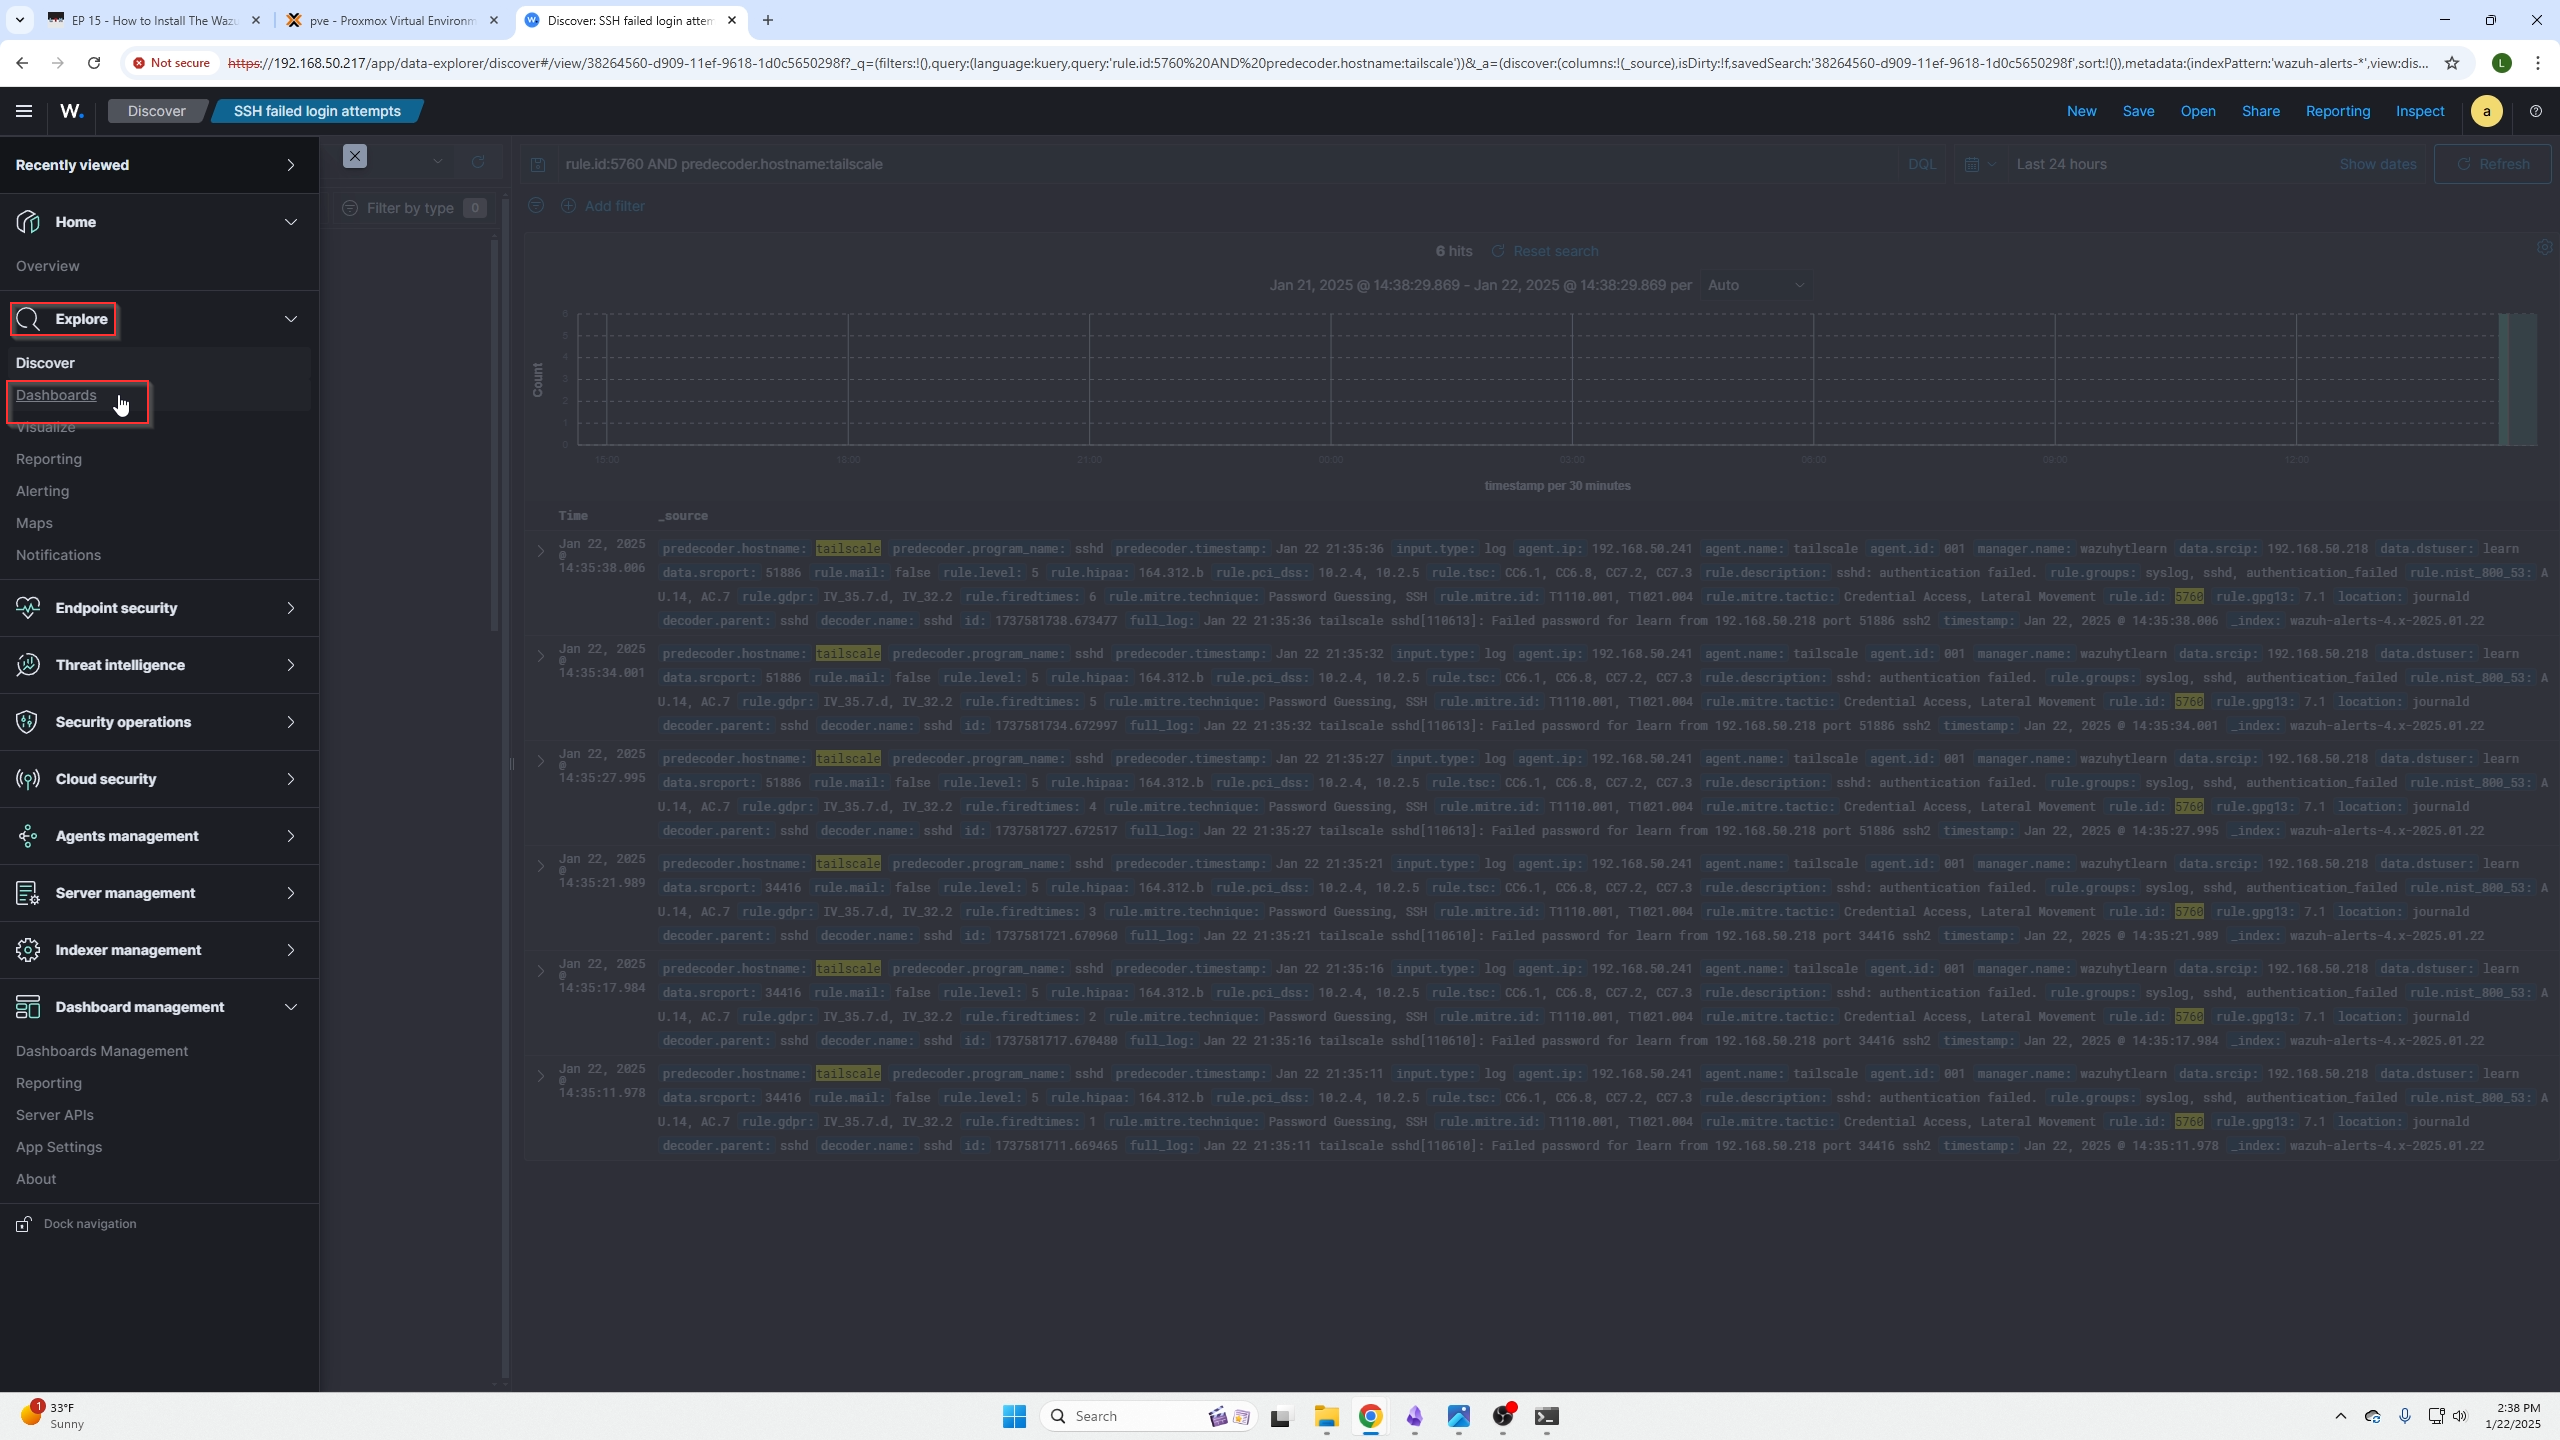
Here you can create a new dashboard or add your query to a dashboard if you have already created one.
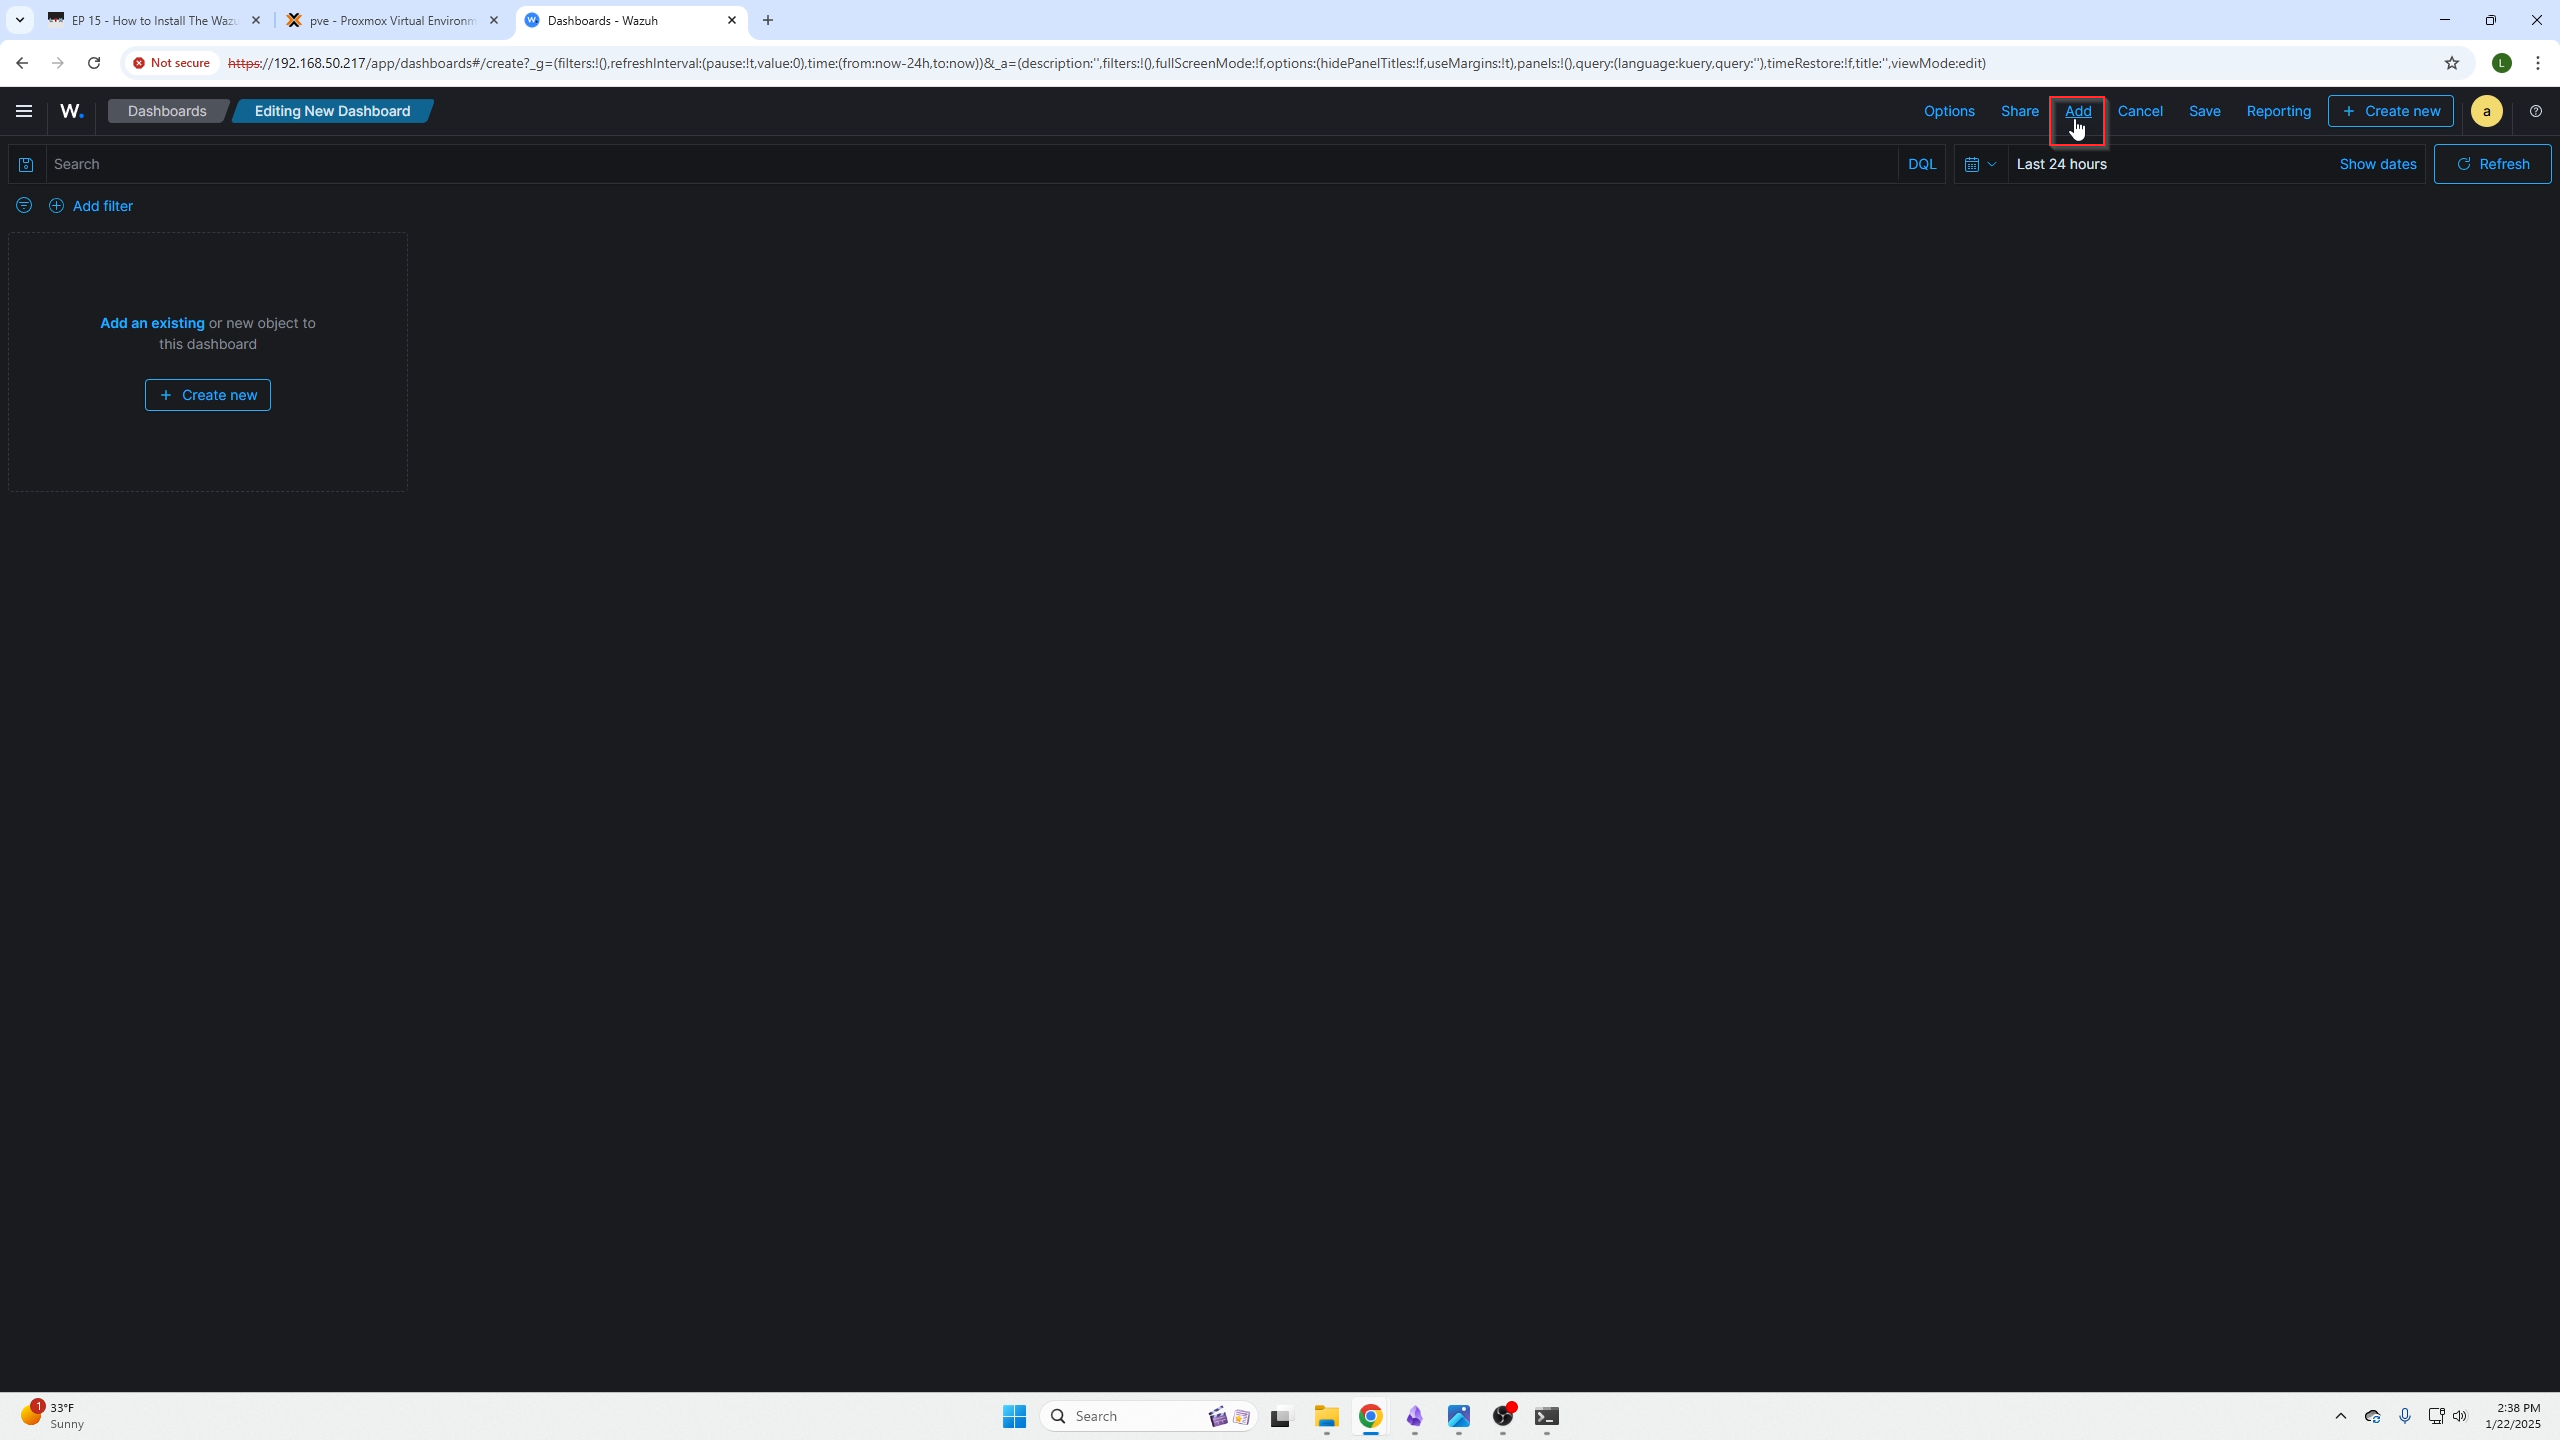
Adding your custom query is as easy and selecting the add button found on the top right.
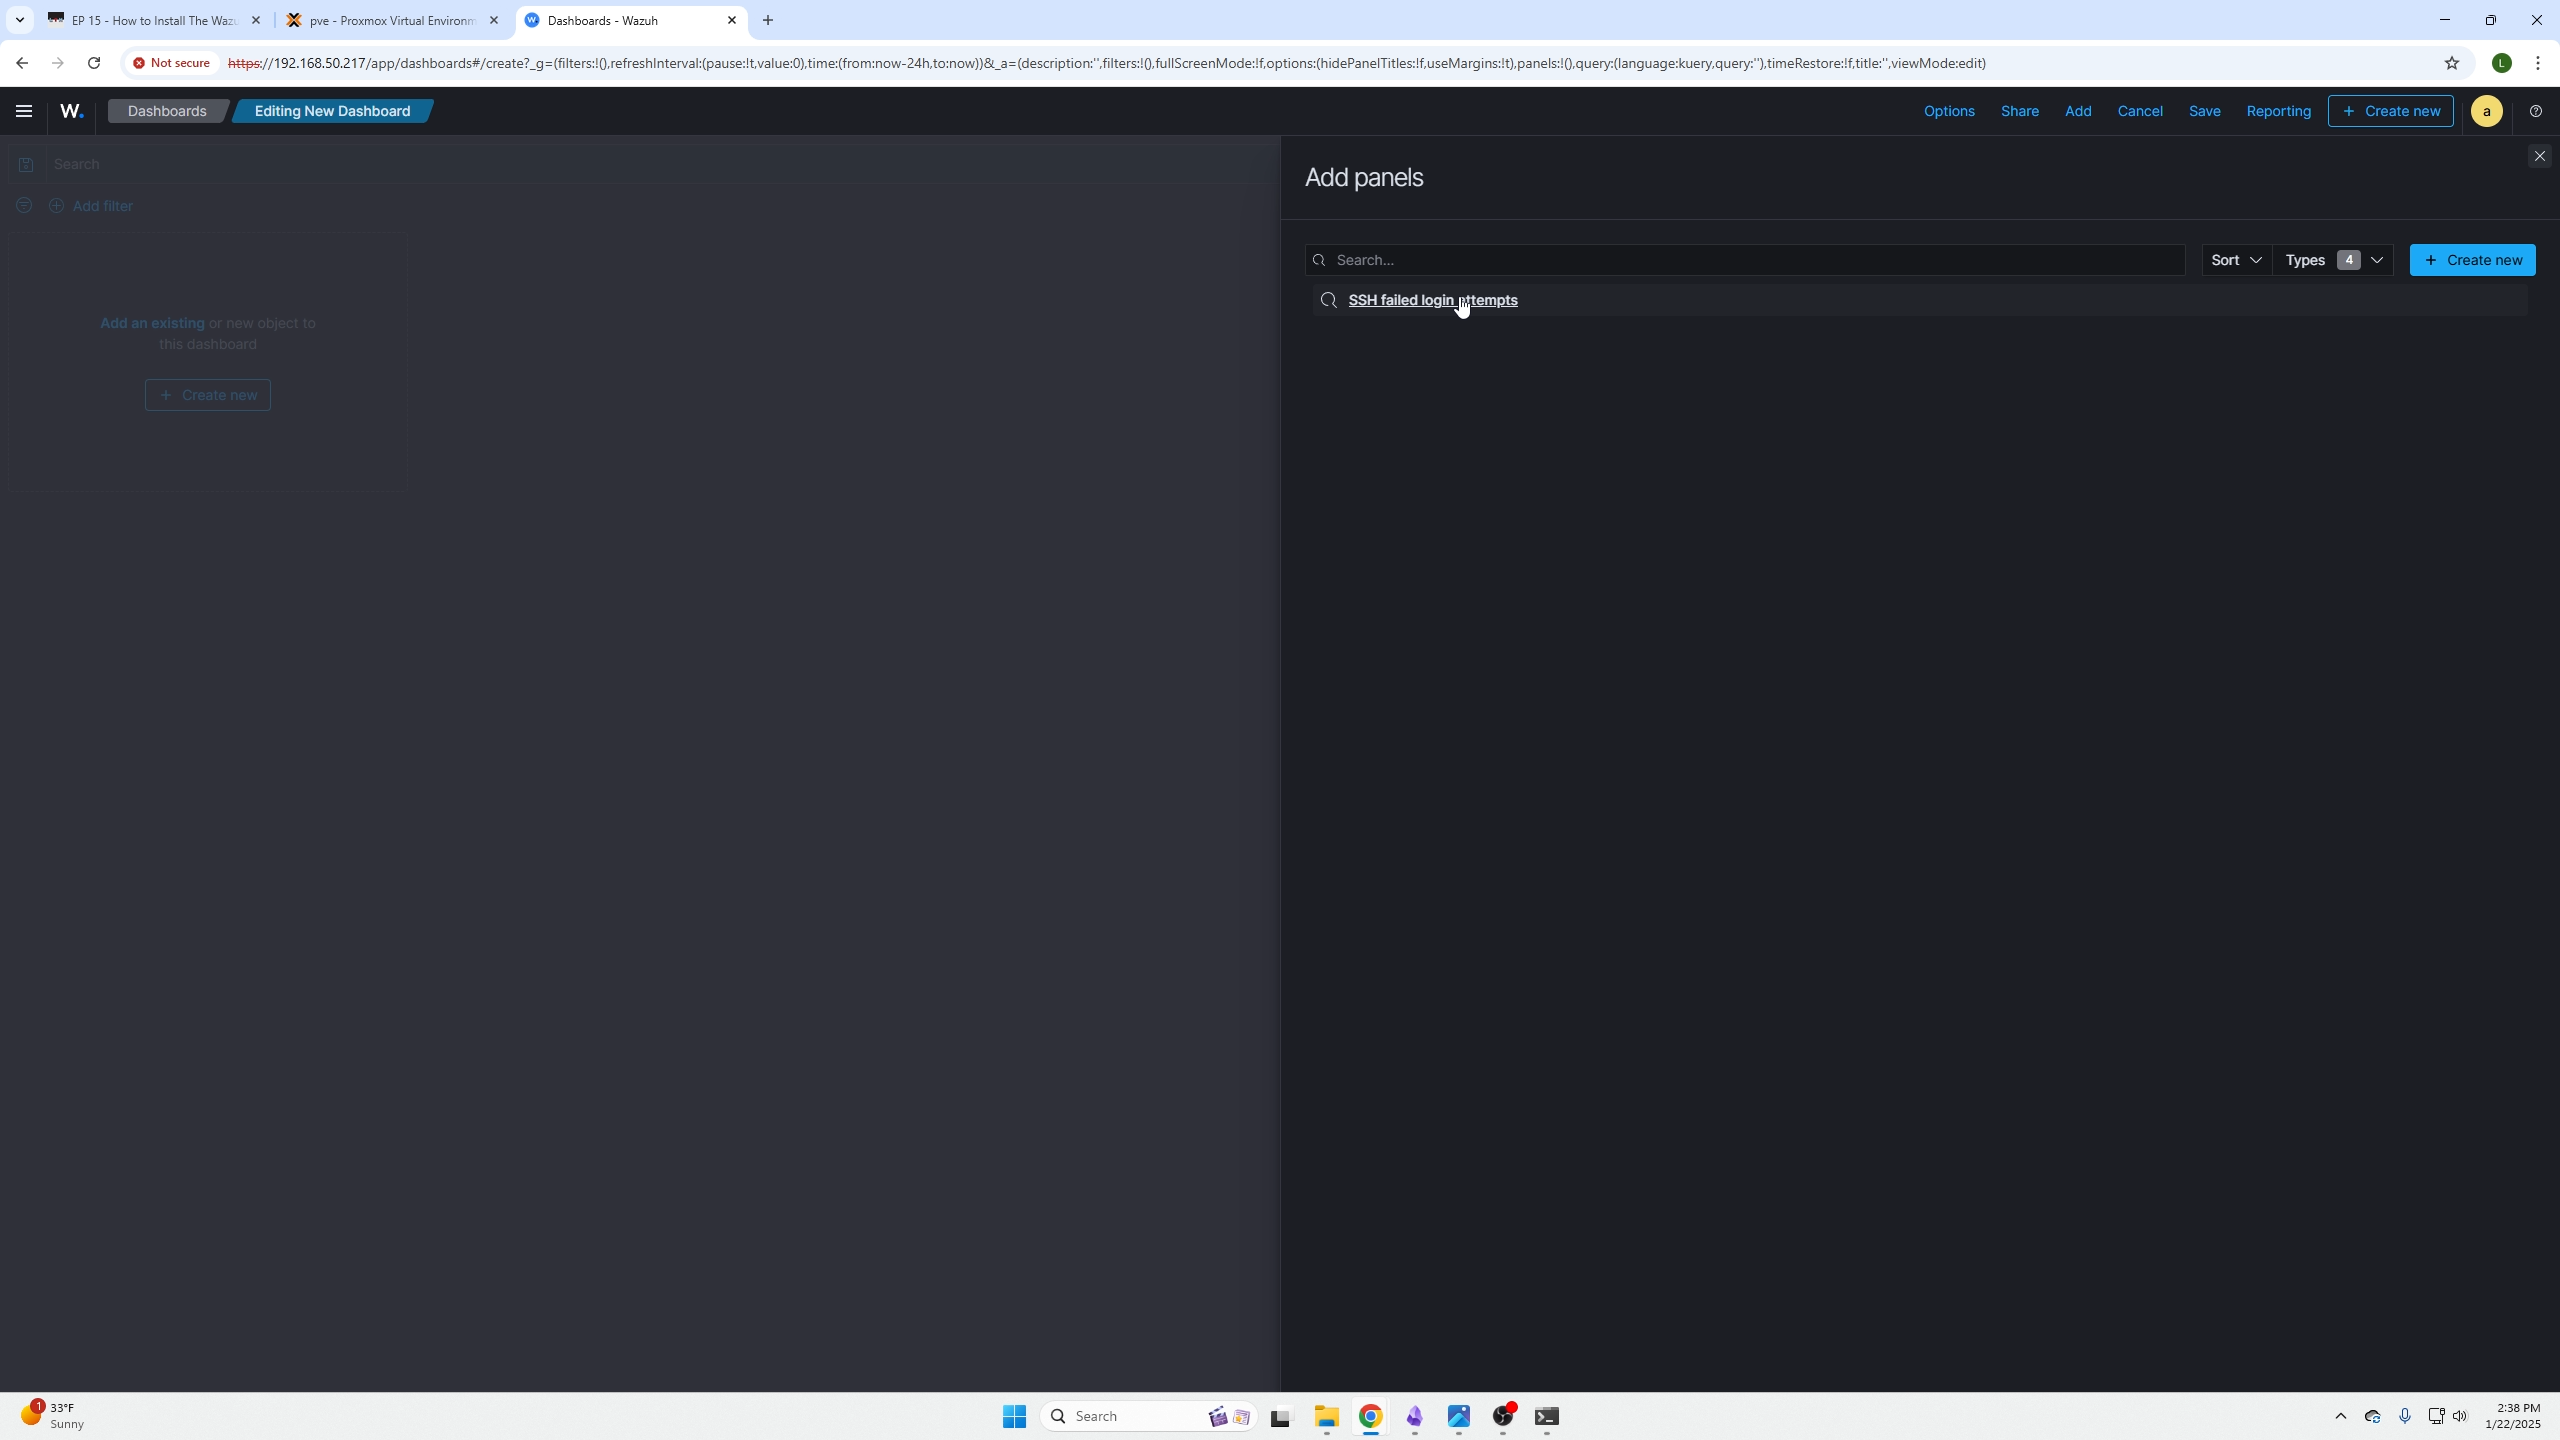
(selecting the query you just made/saved)
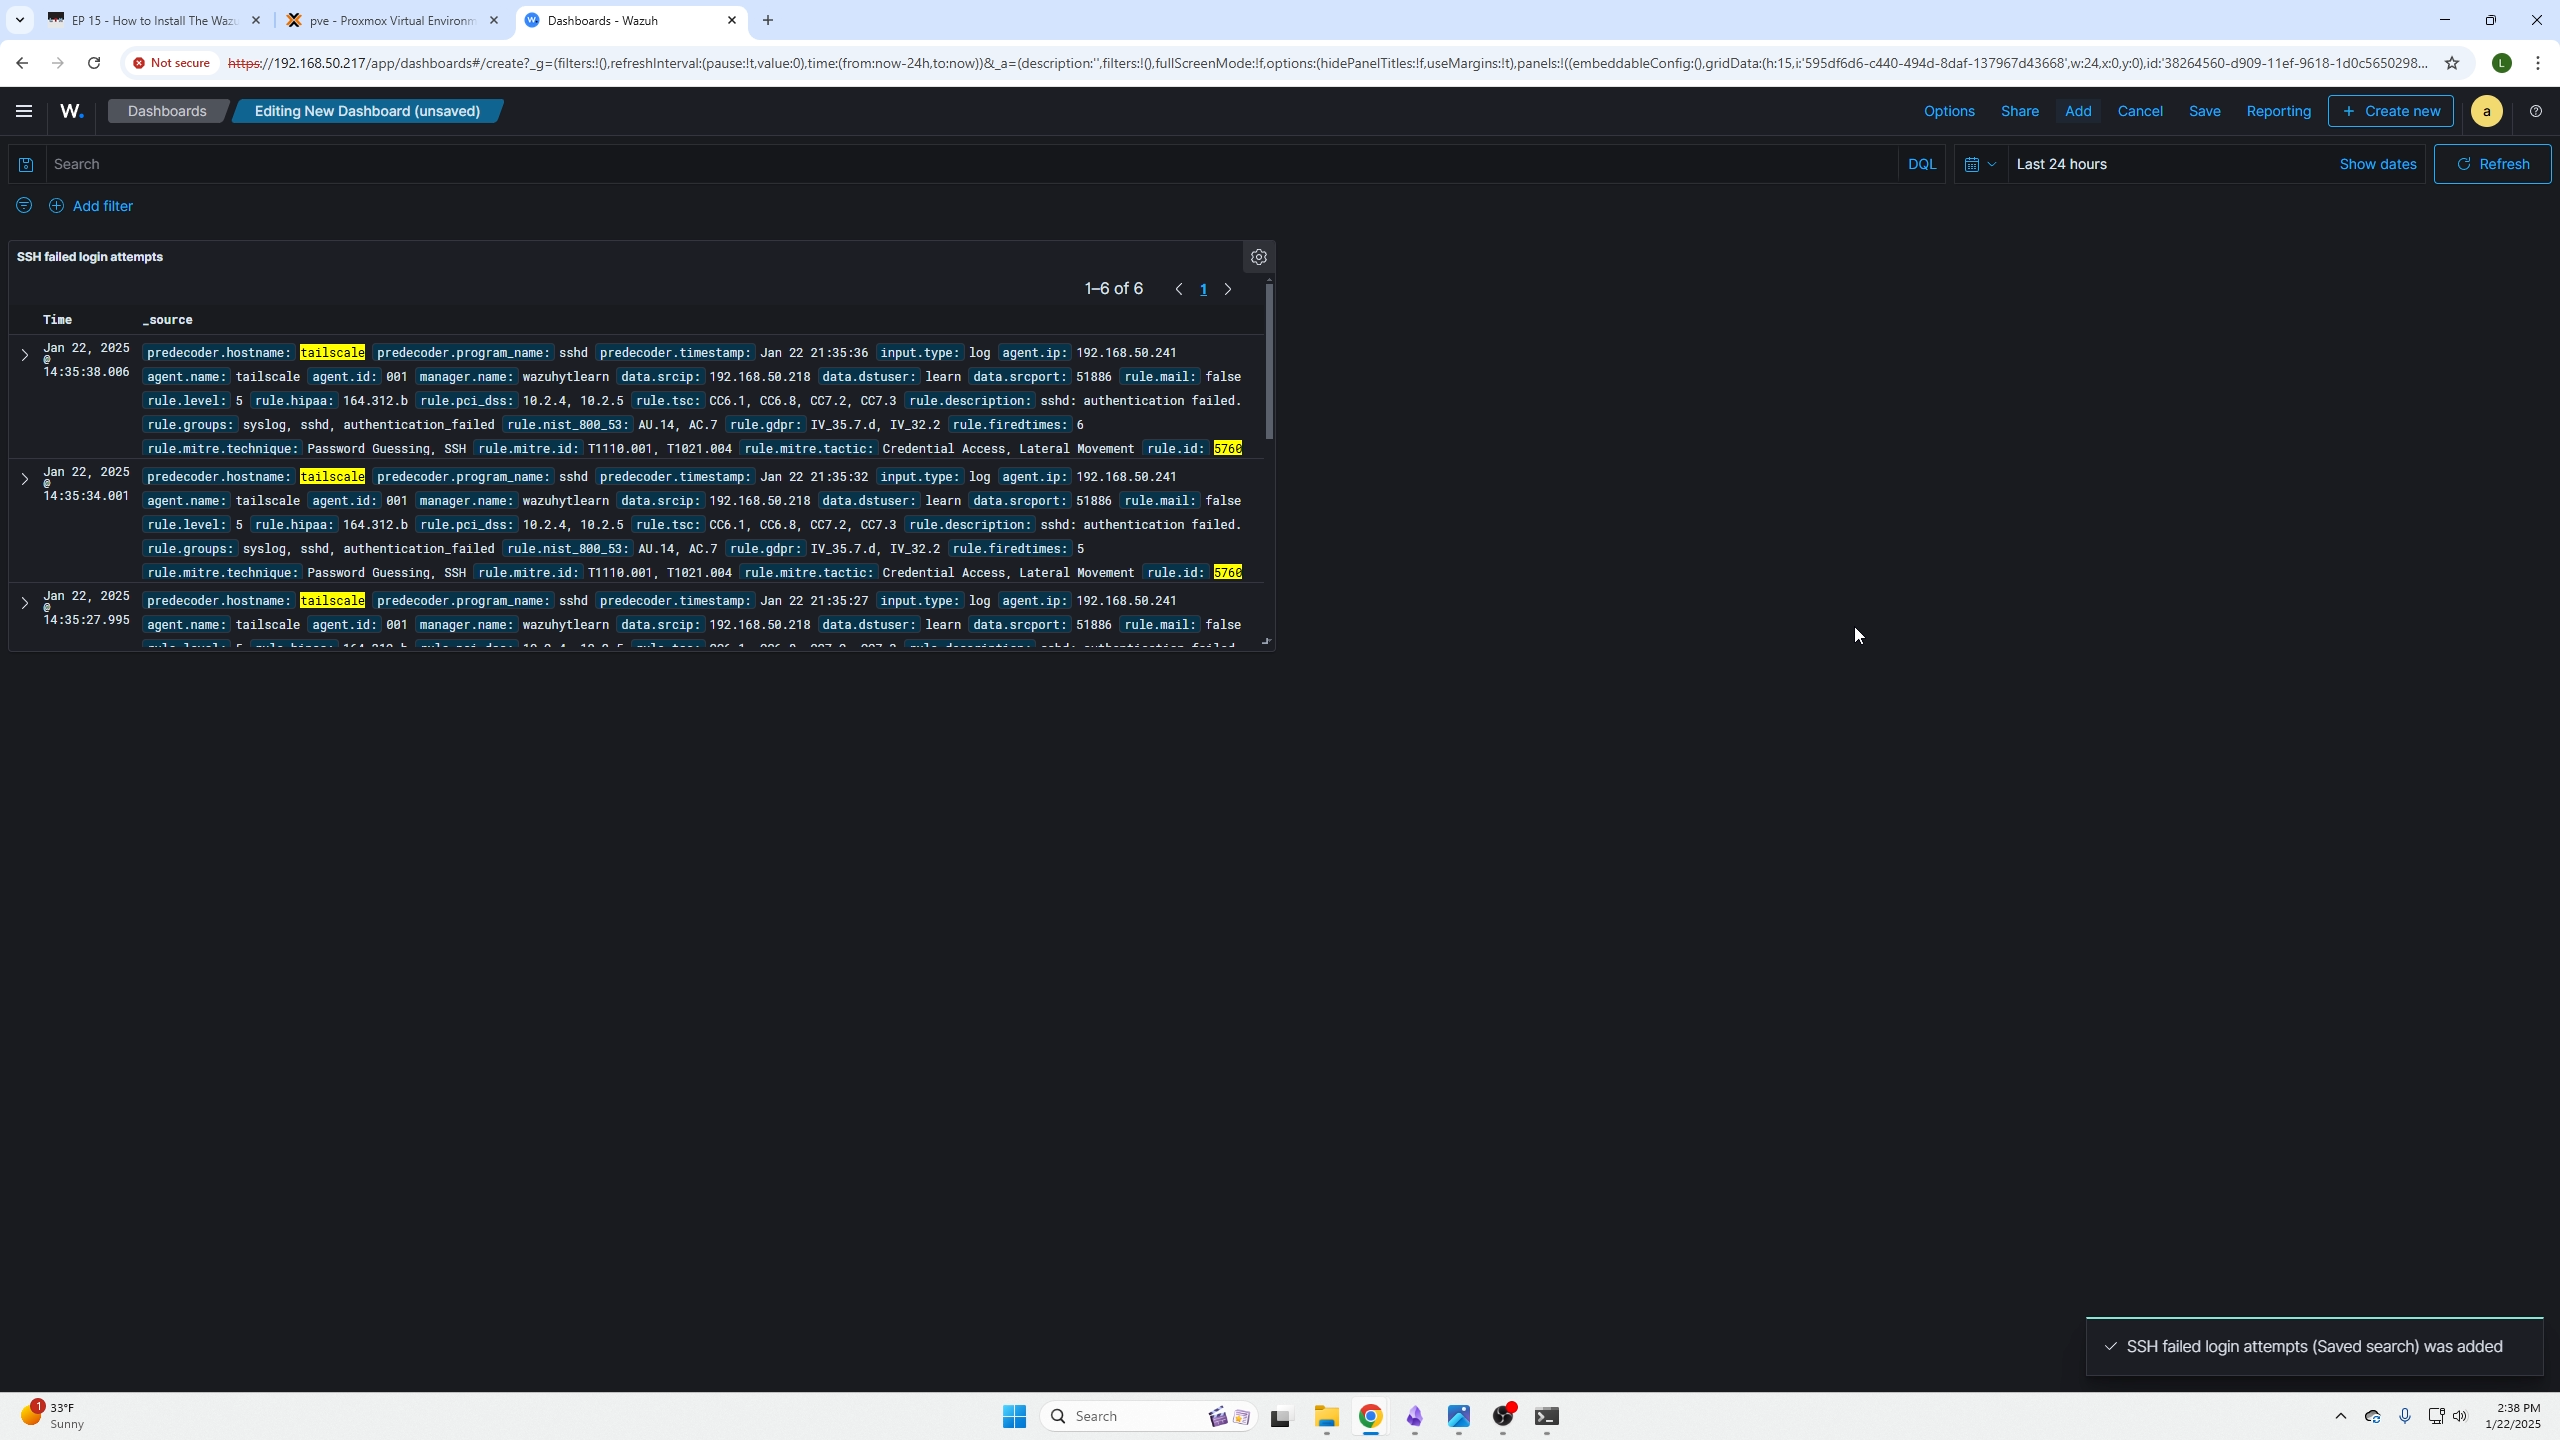
(What it looks like added to the dashboard. You can click save on the top right if you are done or click the gear icon on the top right of your tile to configure your specific tile).
Resolving Findings Found on an Agent
Going back to your agent, it is very unrealistic to be able to solve all the findings but you want to at least handle the critical ones.
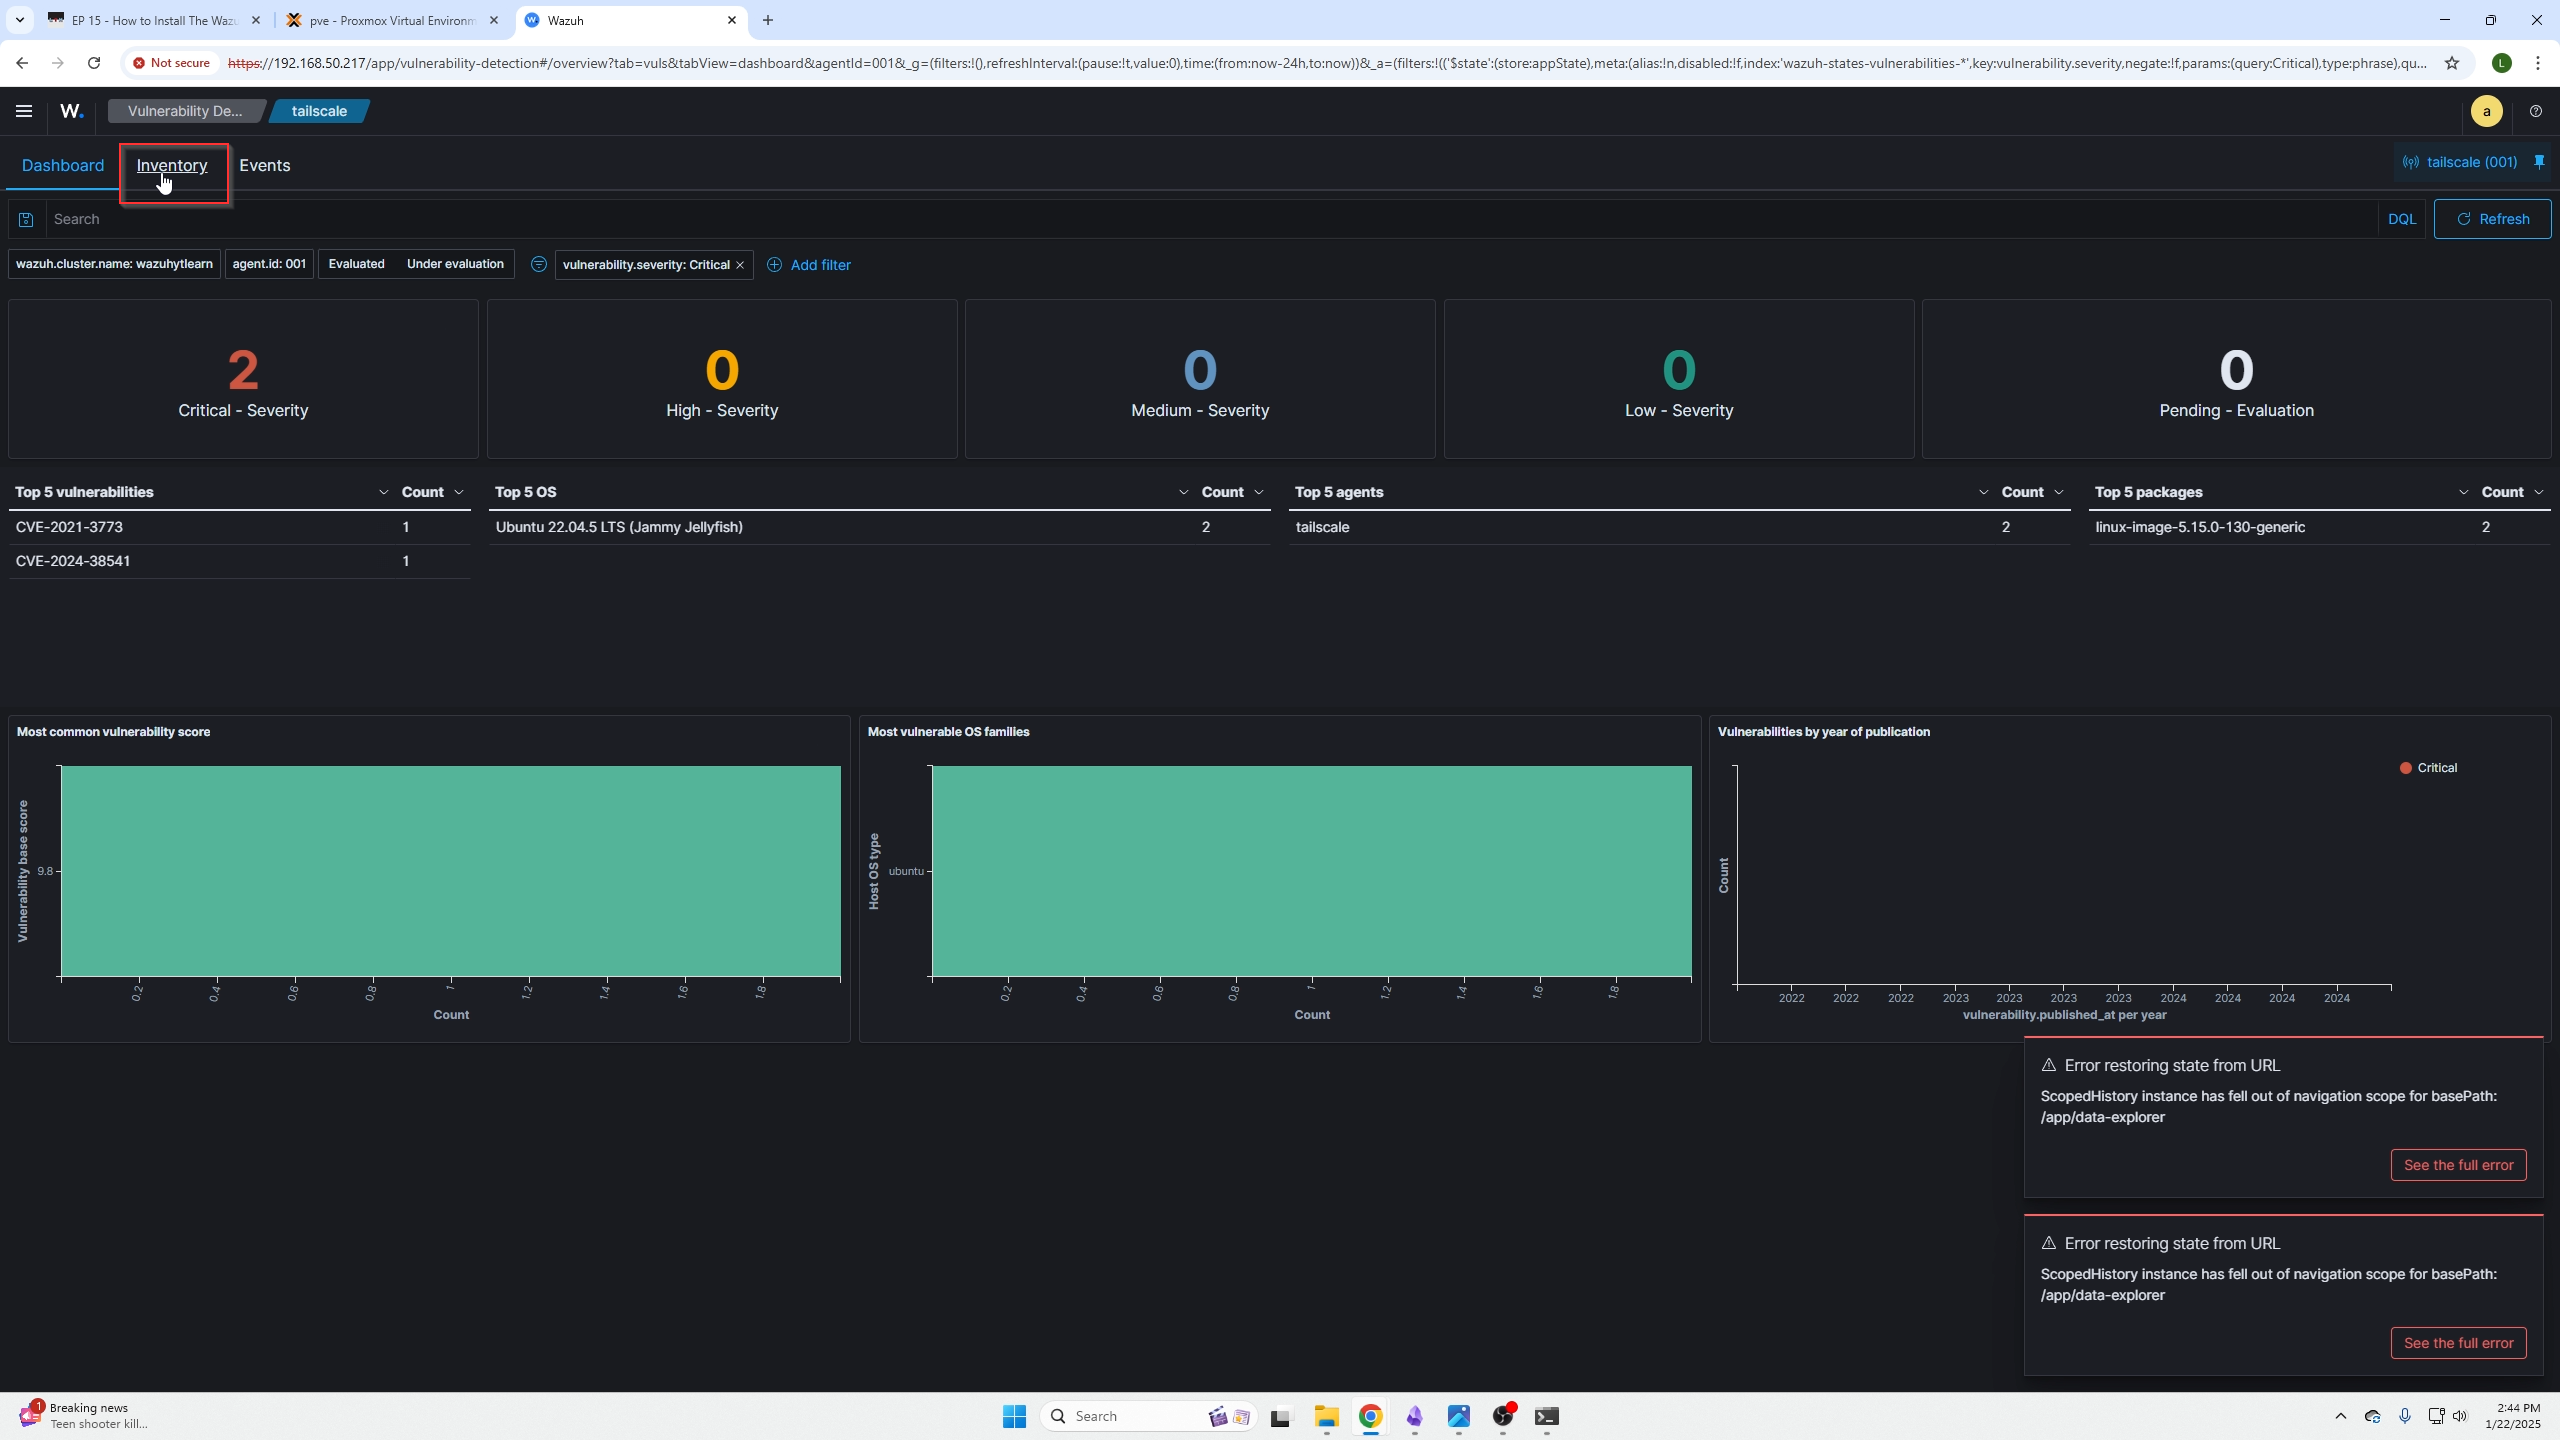
Click on the critical findings.
You will be presnted with this screen, click inventory on the top left for further details on these critical findings.
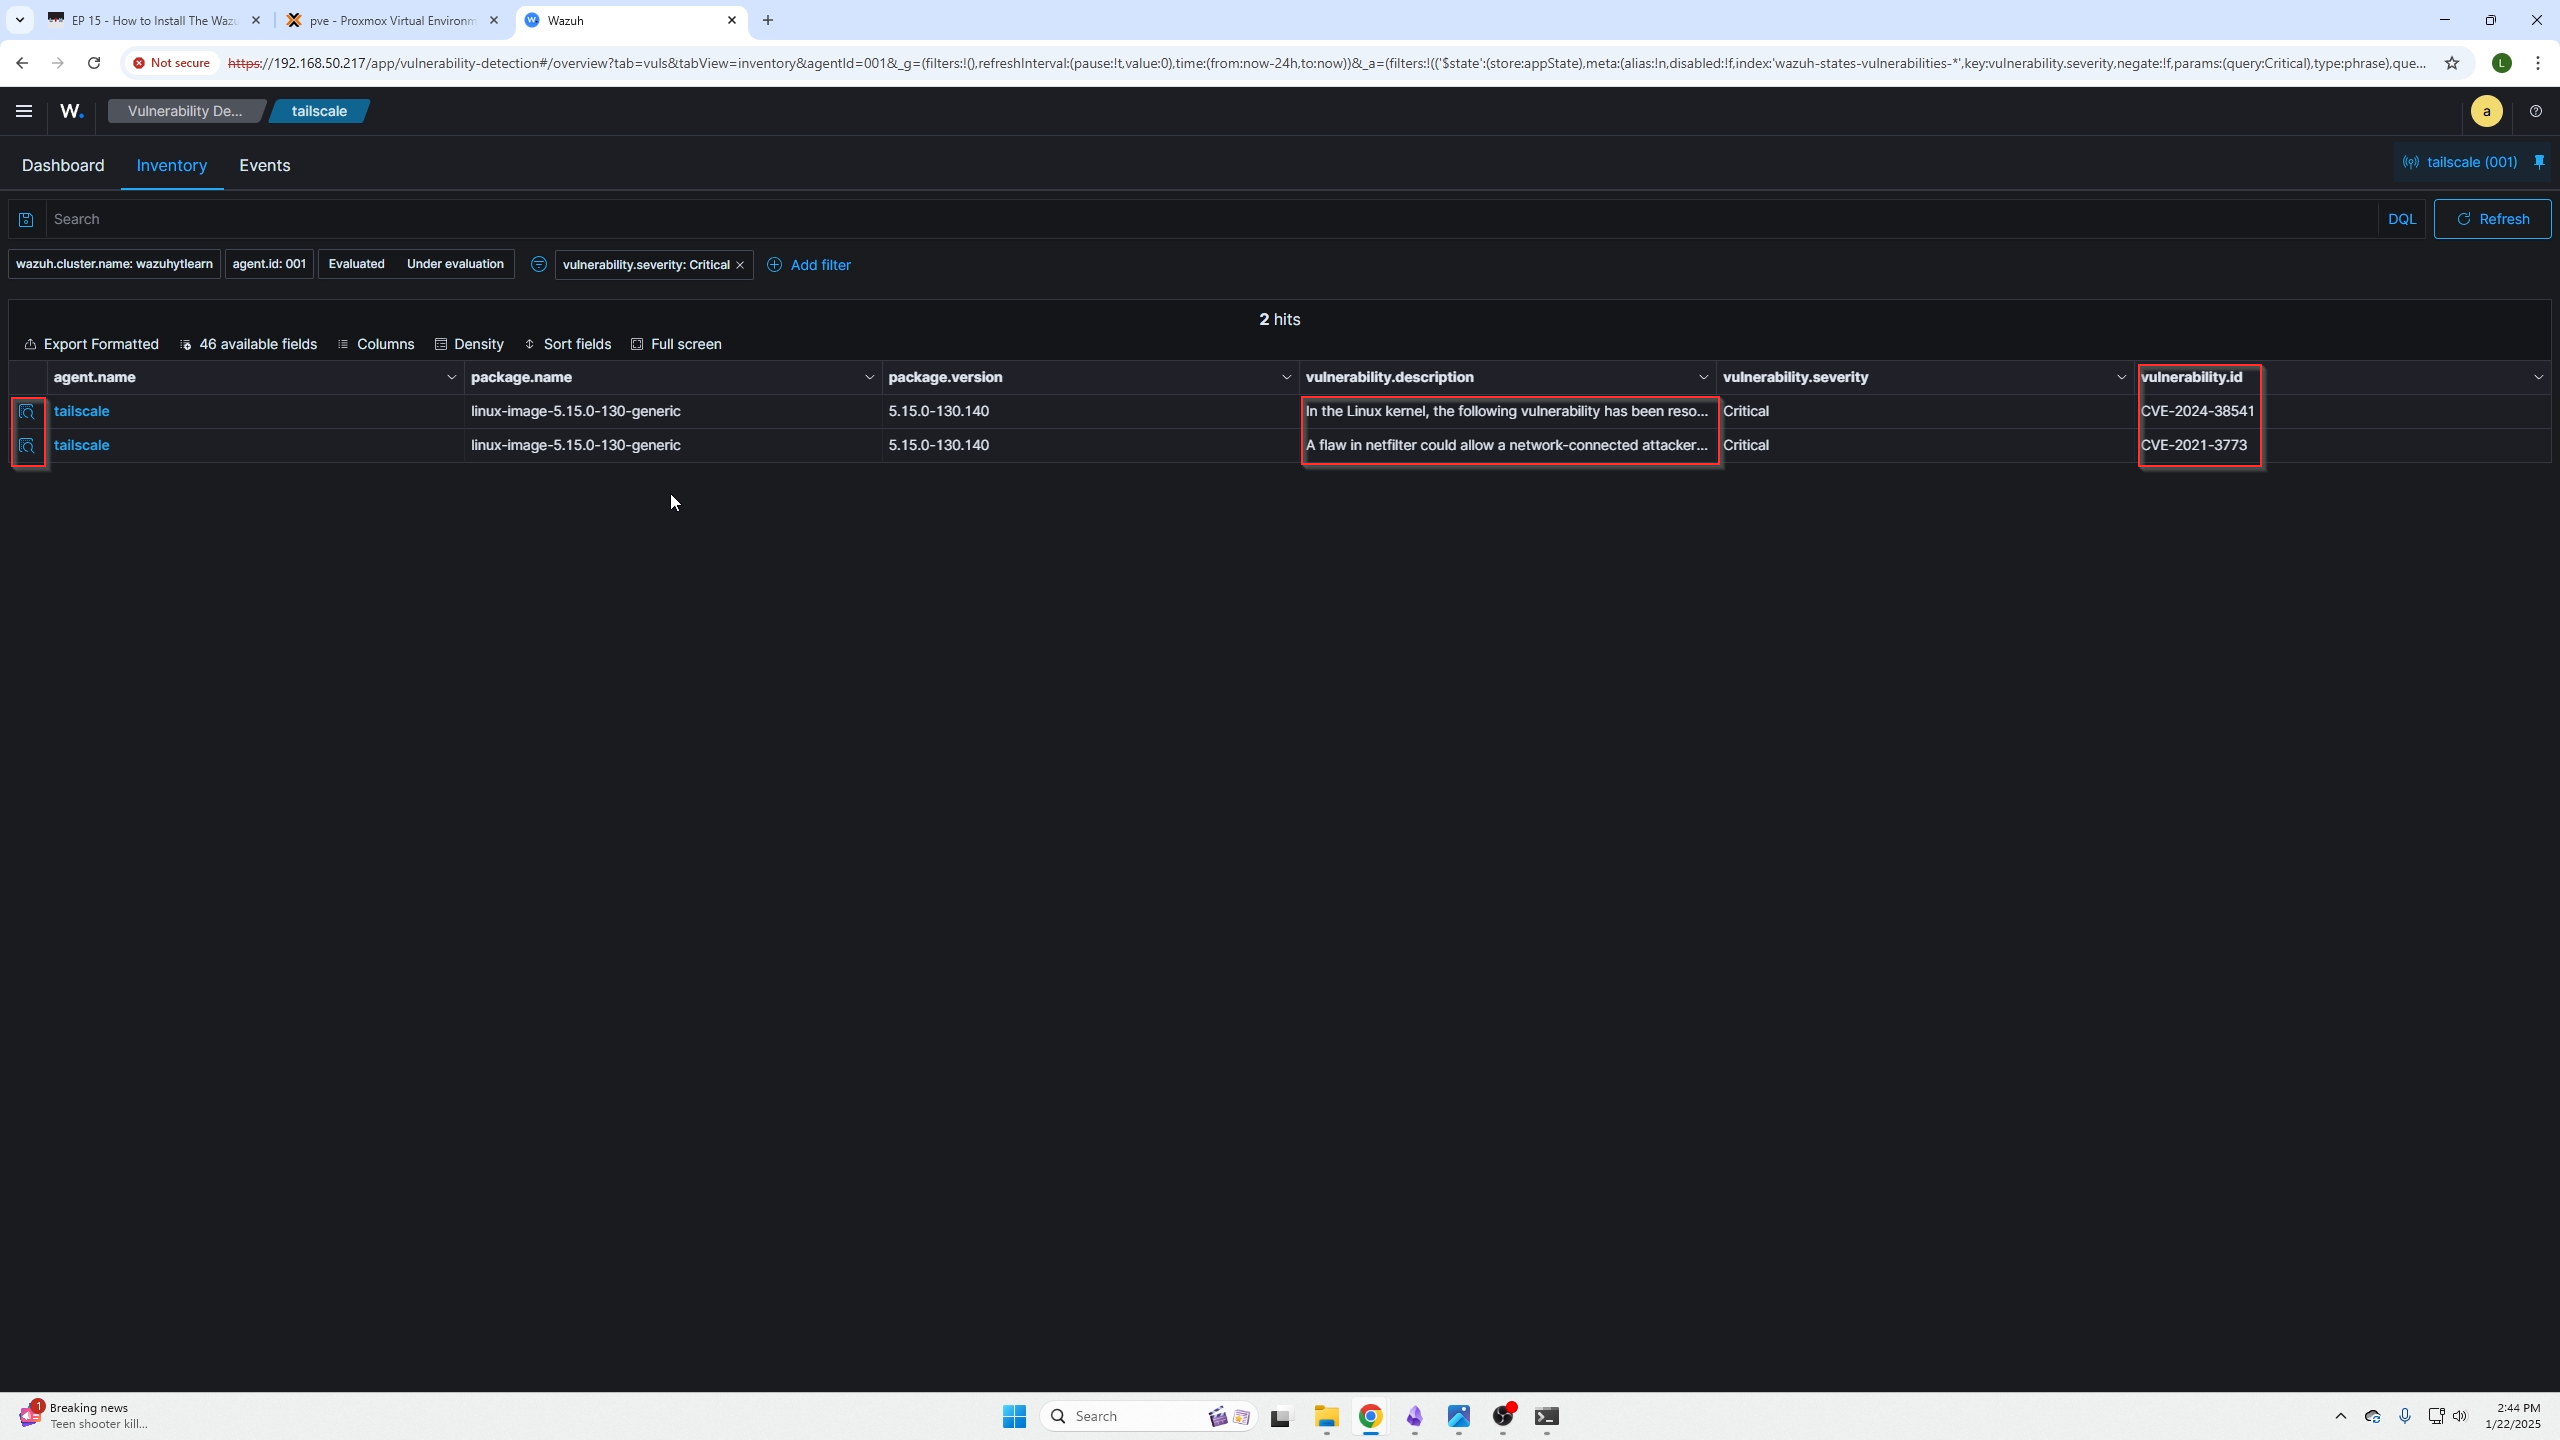
You will be presented with this page.
You can read a brief overview here or select the icons on the far left for a full view with details on the issue.
At this point you are going to have to do some reasearch online of your own. The CVE numbers are a great place to start. After you know why this is bad, the next thing you need to research is how to solve the issue based on your operating system.
This is a very manual thing to do and a timely but if you want real hands on experience this is something you will be doing in the real world.
Conclusion
I hope you found this walkthrough useful! Do not forget to join our discord and share any insights you have with us or give us video recommendations!