Zabbix Agent install on a VM (Linux)
Introduction
In this episode we are going to be covering how to setup a Zabbix Agent specifically for Linux but this method really applies for all ways when it comes to configuring the devices.
If you want to know how to setup the Zabbix server please find our article/video on that here
Getting started
-
Find the current agent commands here Select the current Zabbix version you are installing, OS, OS version, Zabbix component (AGENT), database will be MYSQL, and Web server is APACHE
-
Login to your Zabbix Server Panel in the Browser
-
Lastly, select what VM/Machine(s) you want to install your agent(s) on.
Step by step guide
Now go ahead and login to your select VM/Machine(s)
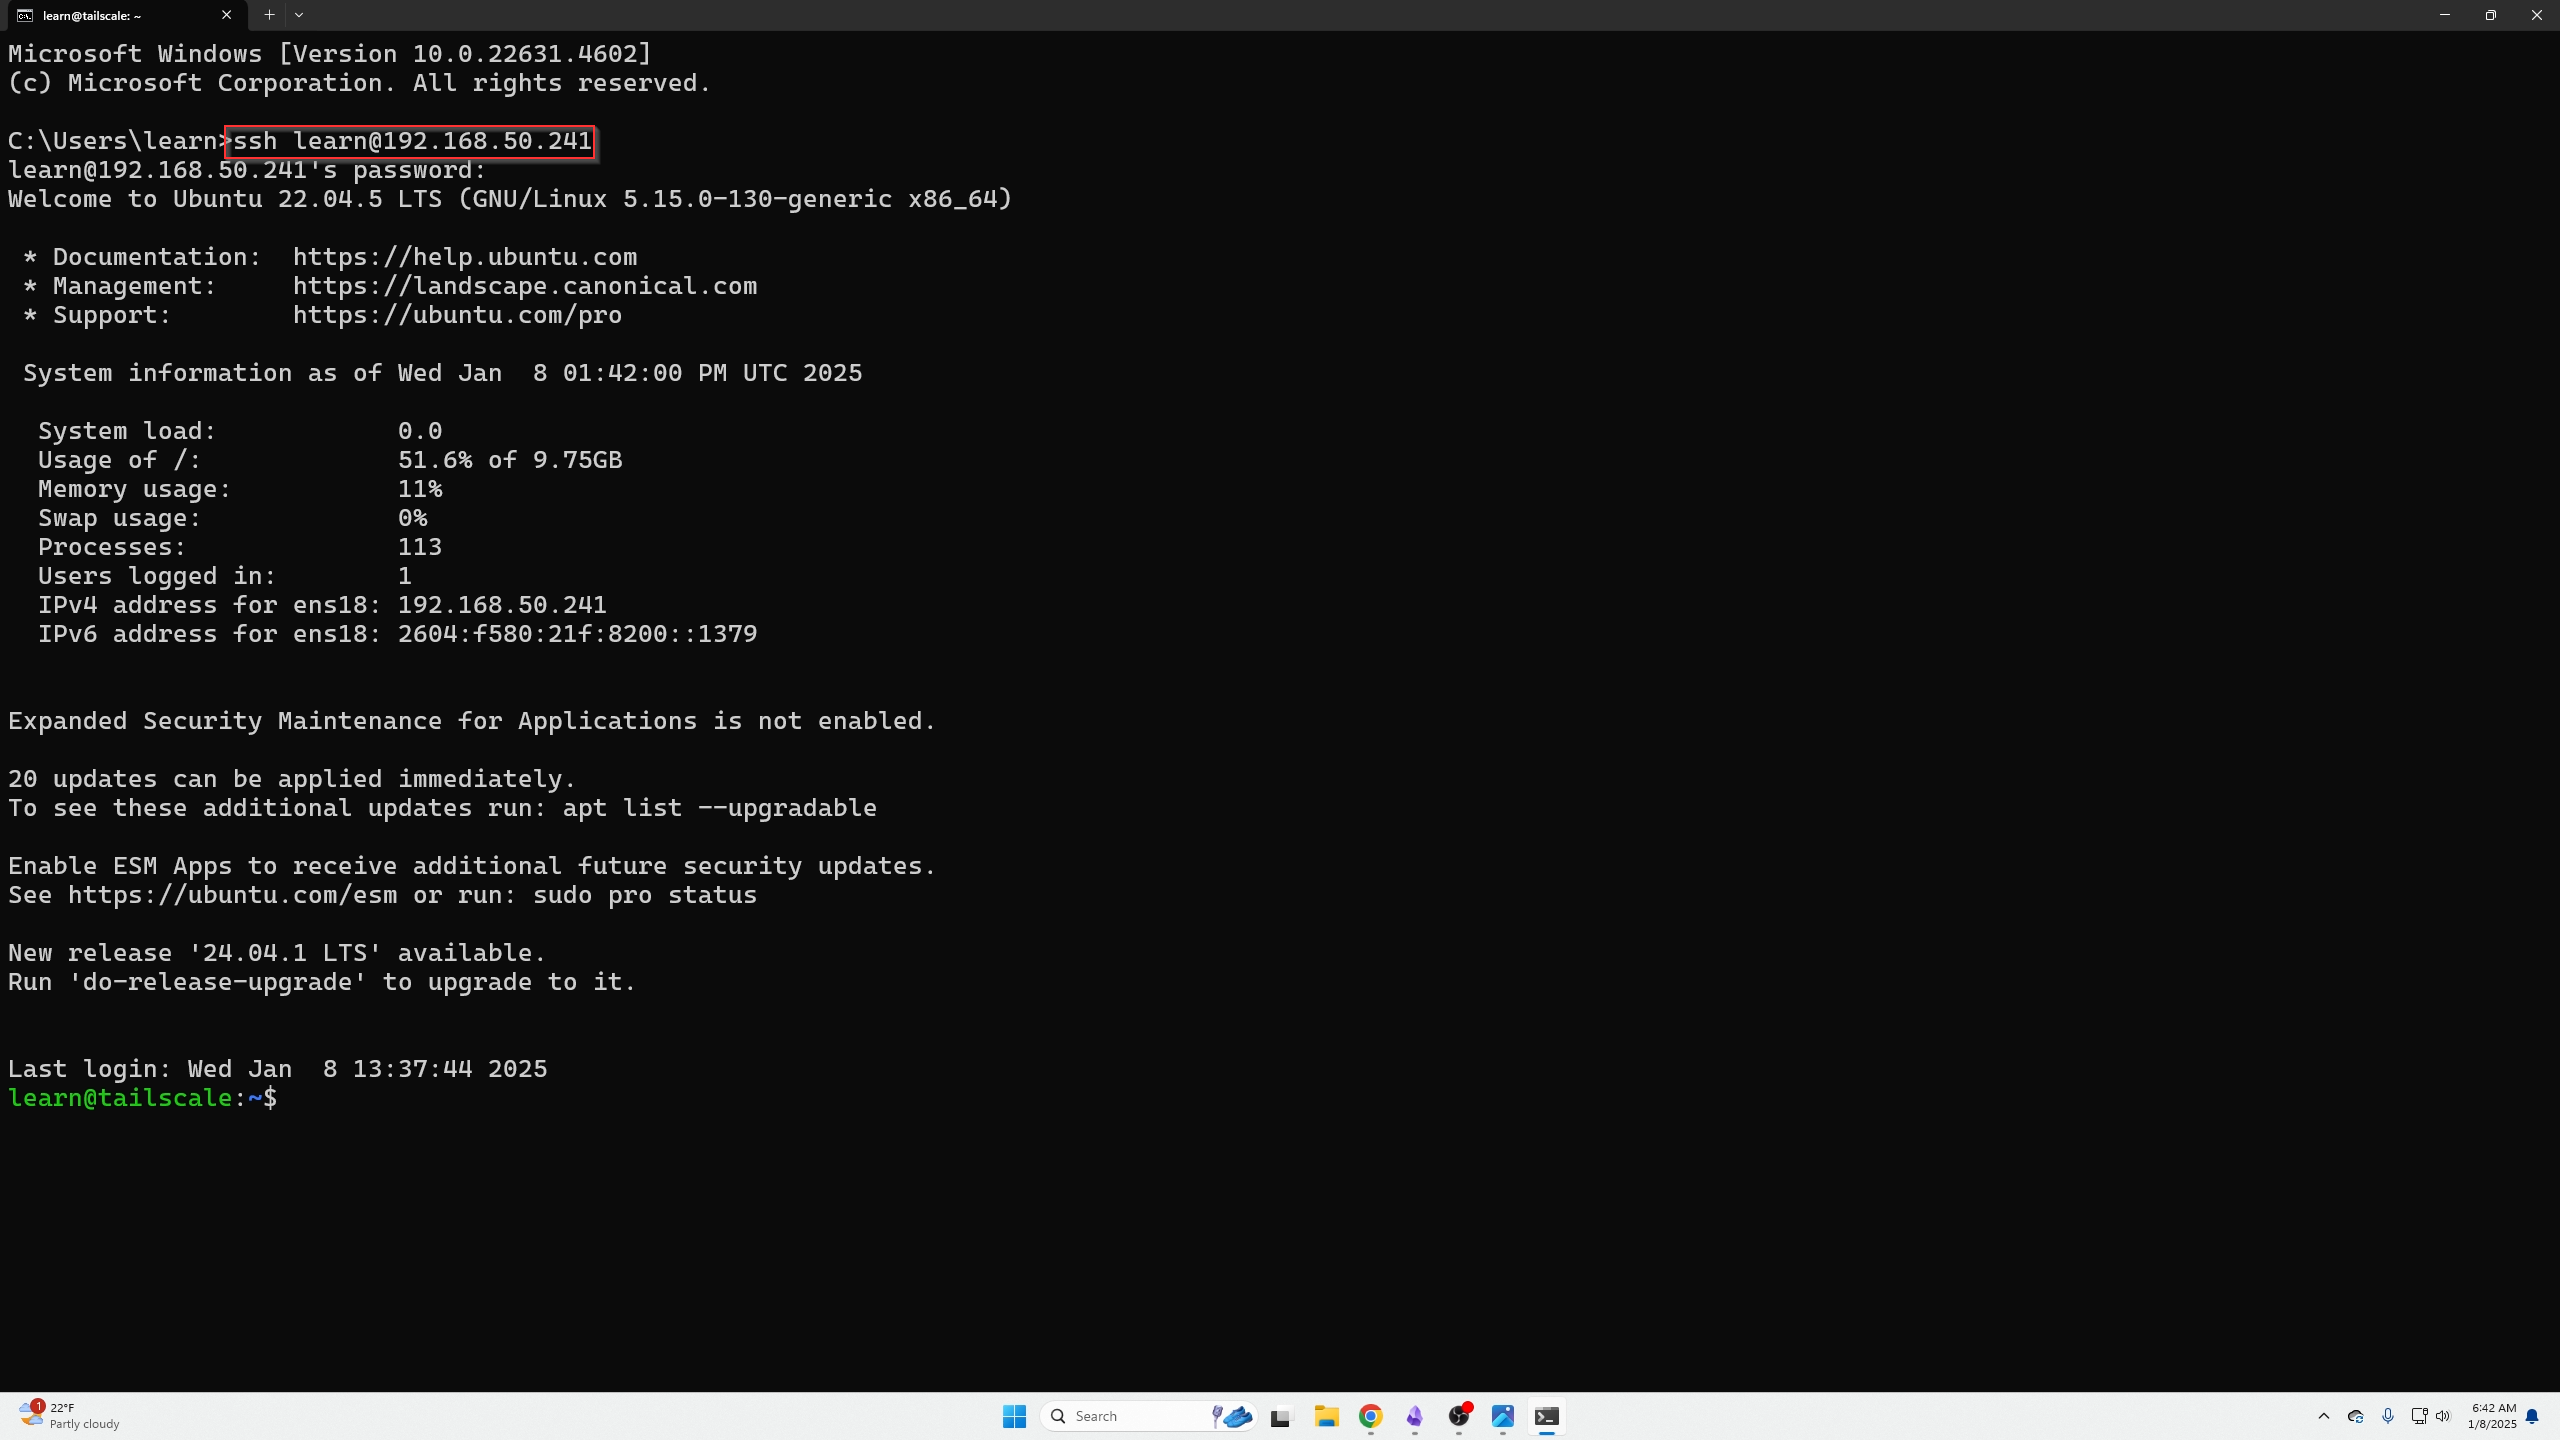
We are going to start installing the Zabbix Agent using the commands found from our getting started section step 1. In this case we are installing 7.0 for the following commands:
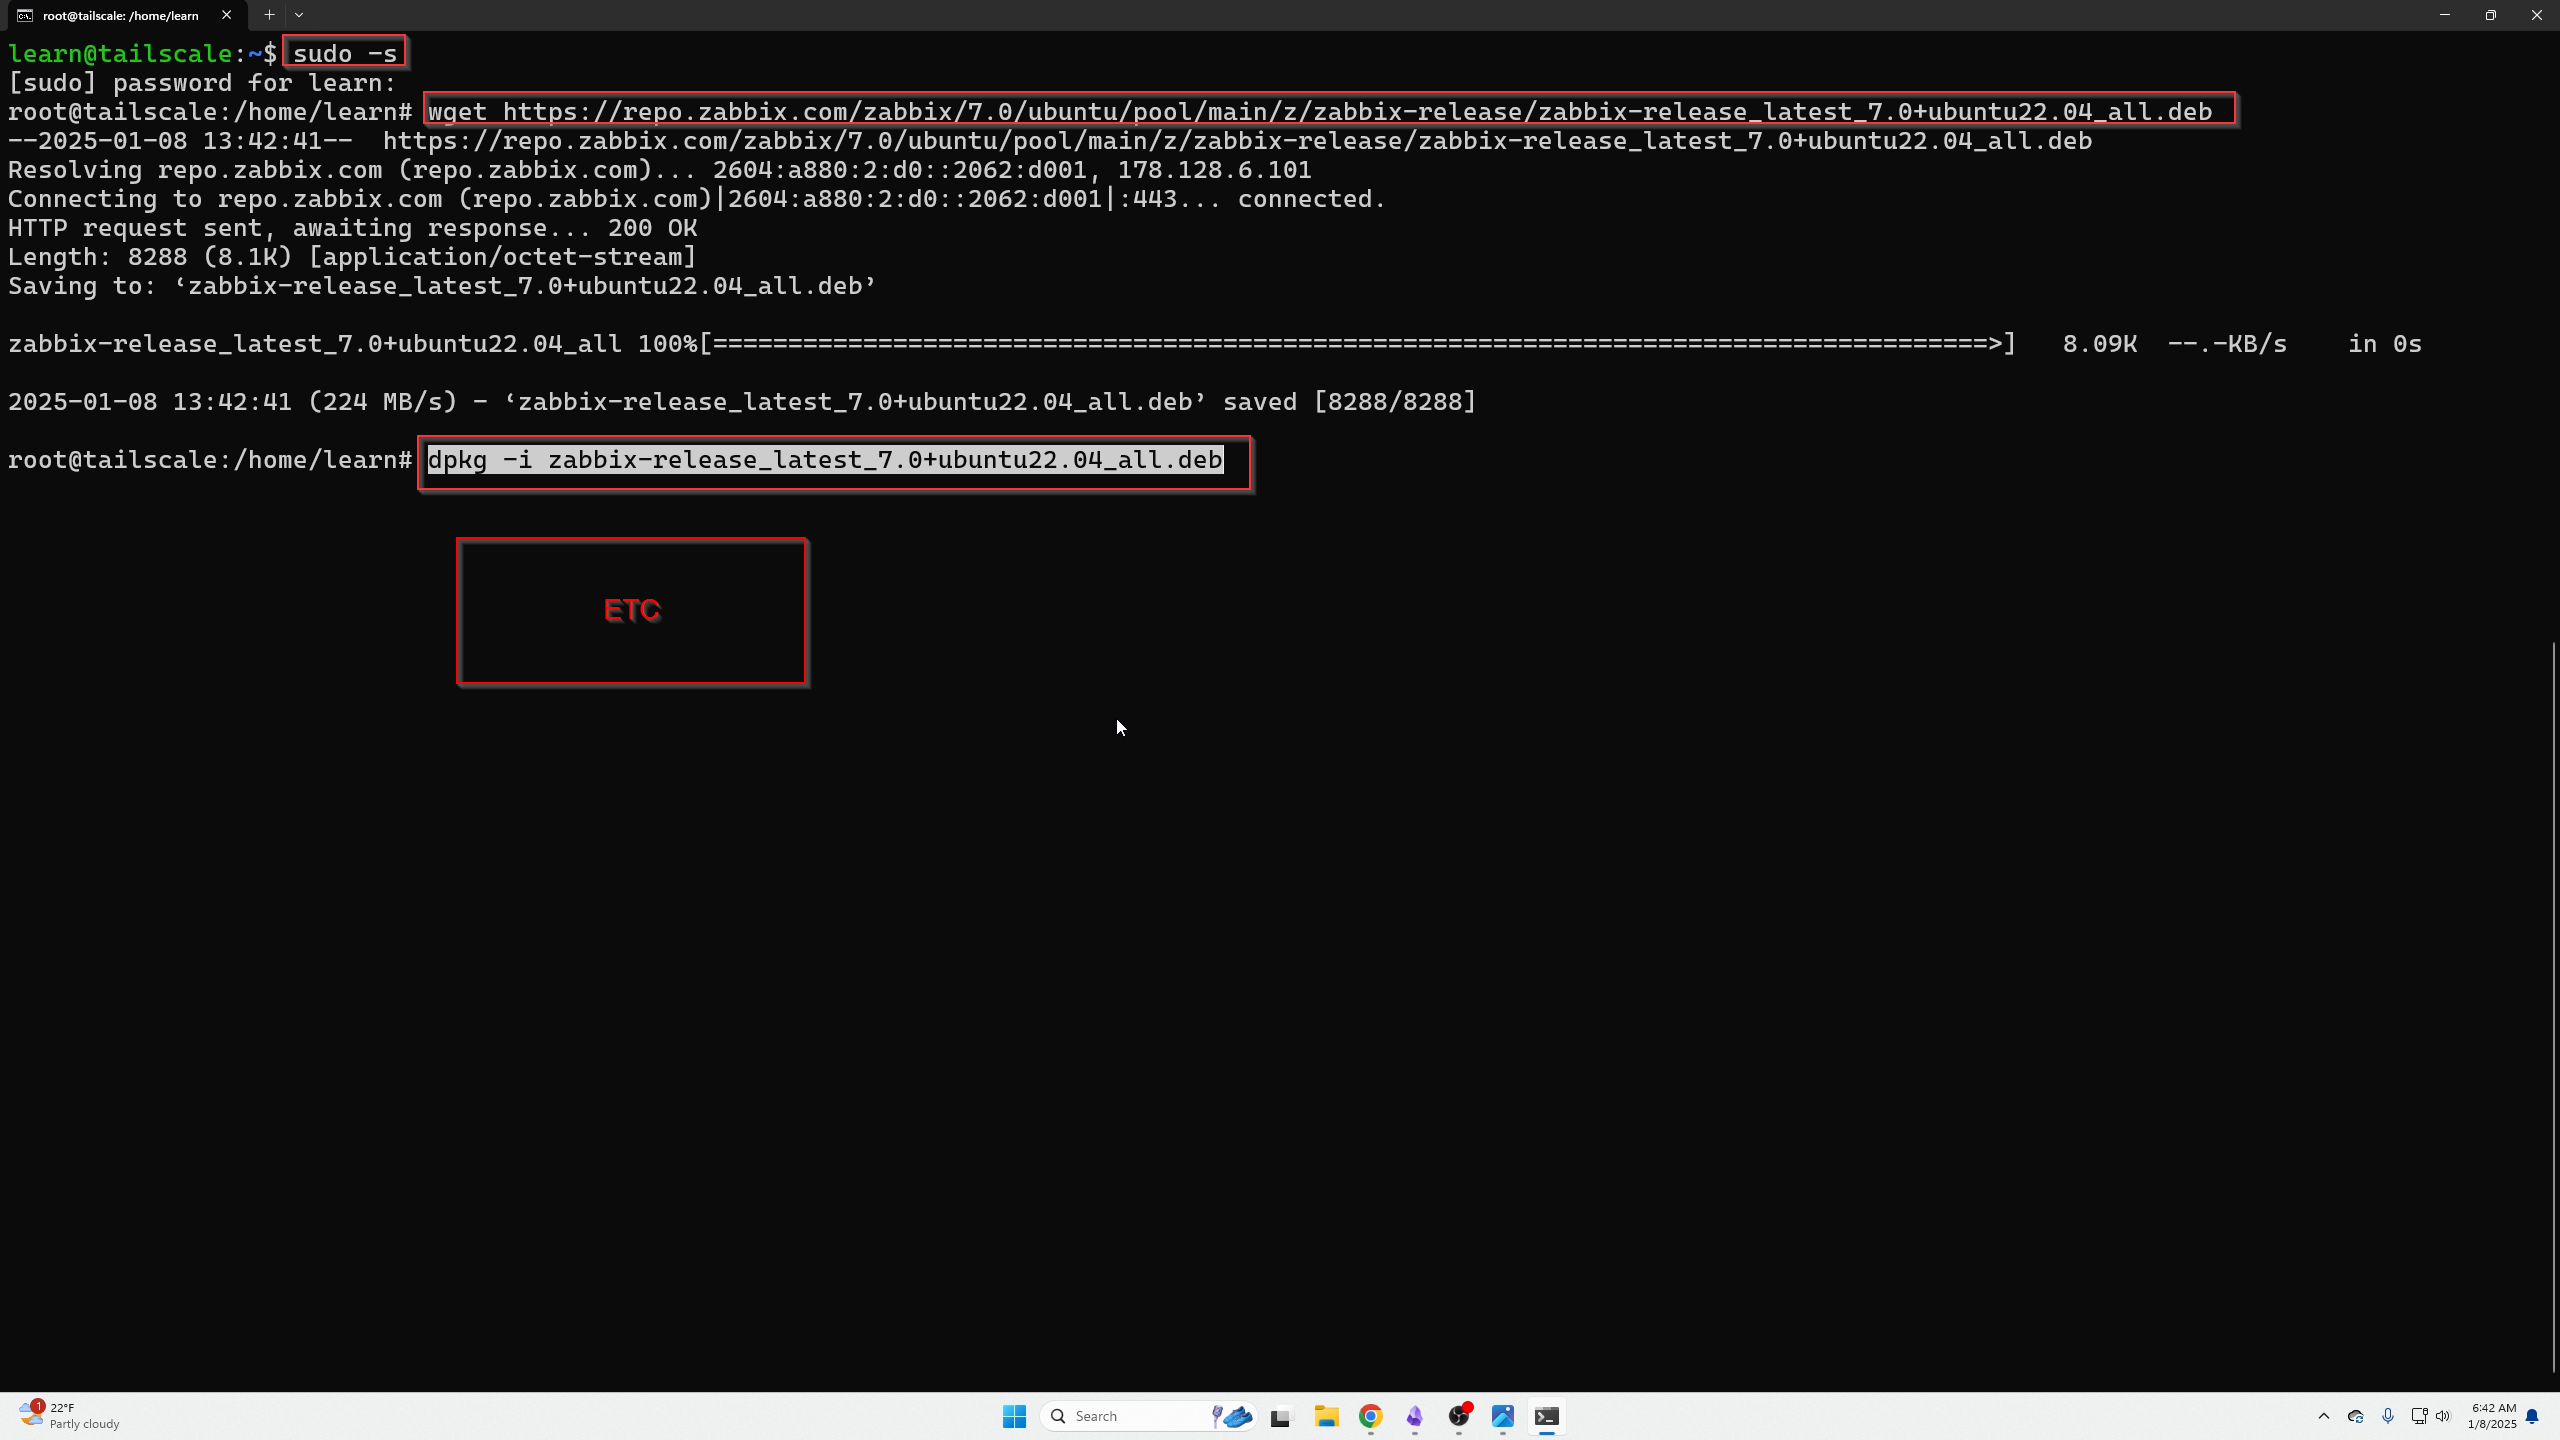
Makes you a super user:
Install the REPO:
wget https://repo.zabbix.com/zabbix/7.0/ubuntu/pool/main/z/zabbix-release/zabbix-release_latest_7.0+ubuntu22.04_all.deb
Unpackage the REPO:
Update the REPOS:
Install the Agent
Start the Zabbix Process
AND
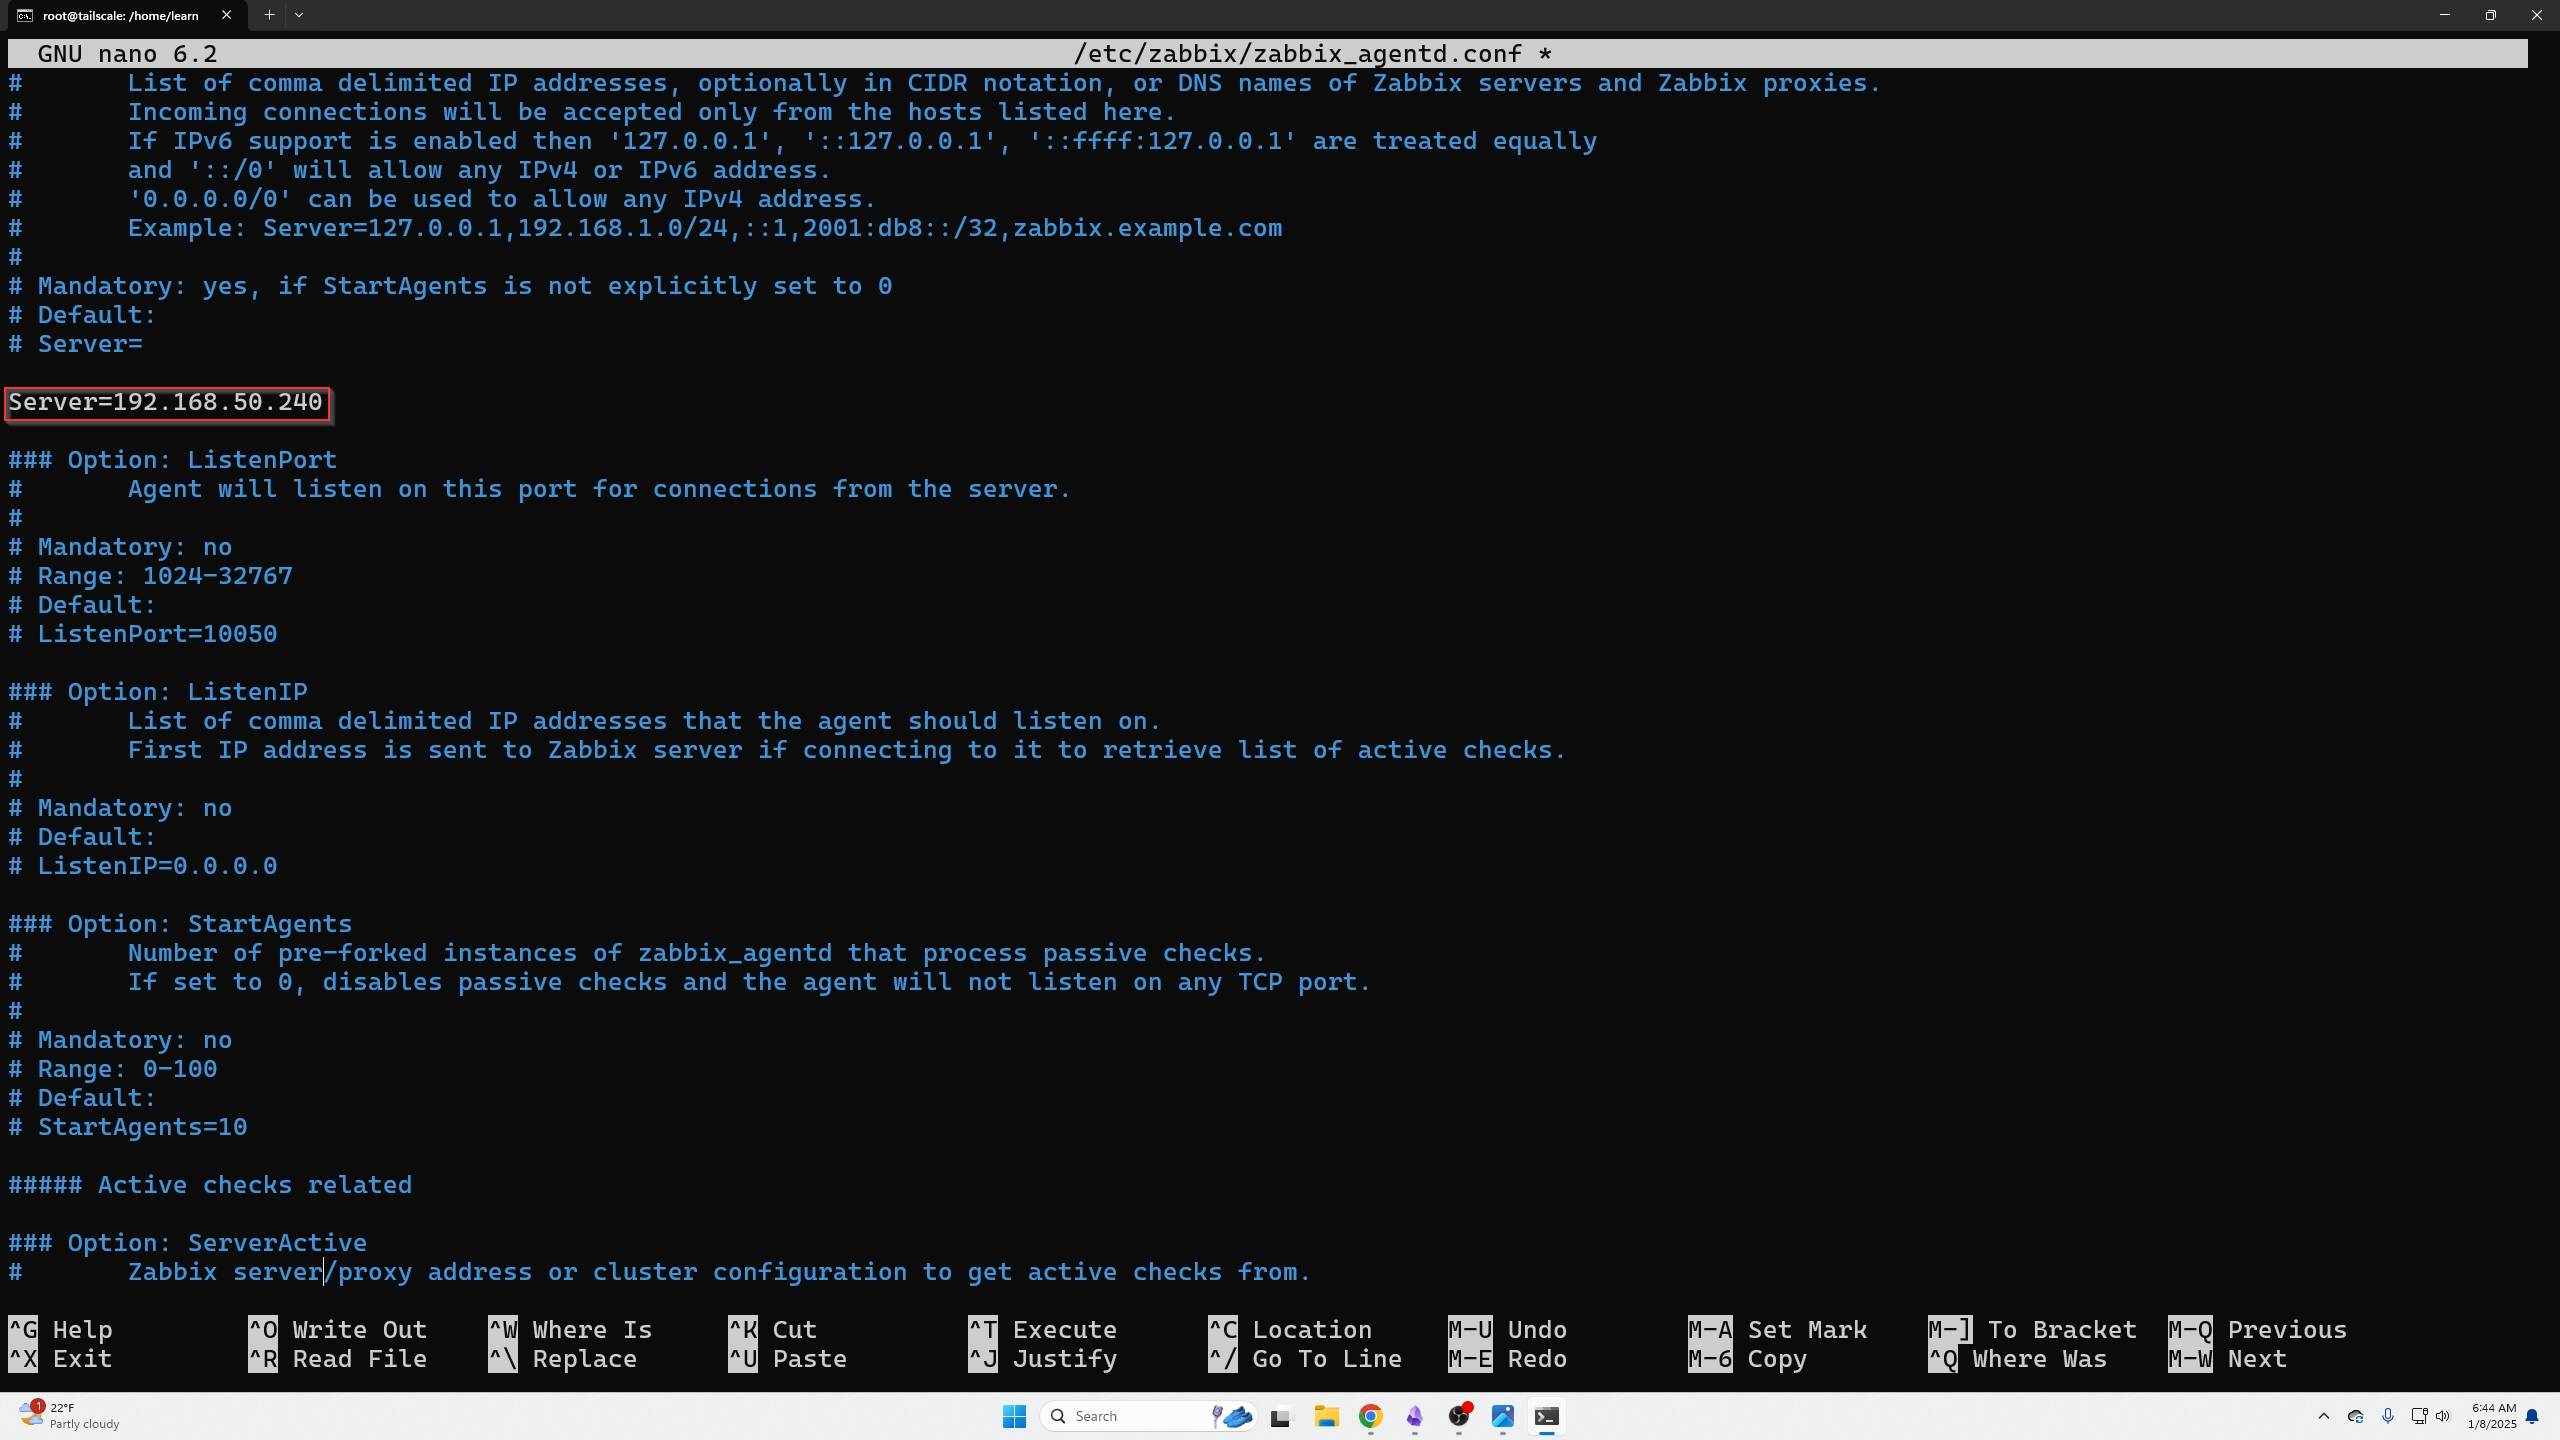
Configure the Zabbix Agent Config file
Now we need to change two entires in our config file. We need to point our AGENT AT the IP address of our Zabbix SERVER!
That will be done with the following commands:
Within that file you need to find:
-
Change server=(your zabbix server IP)
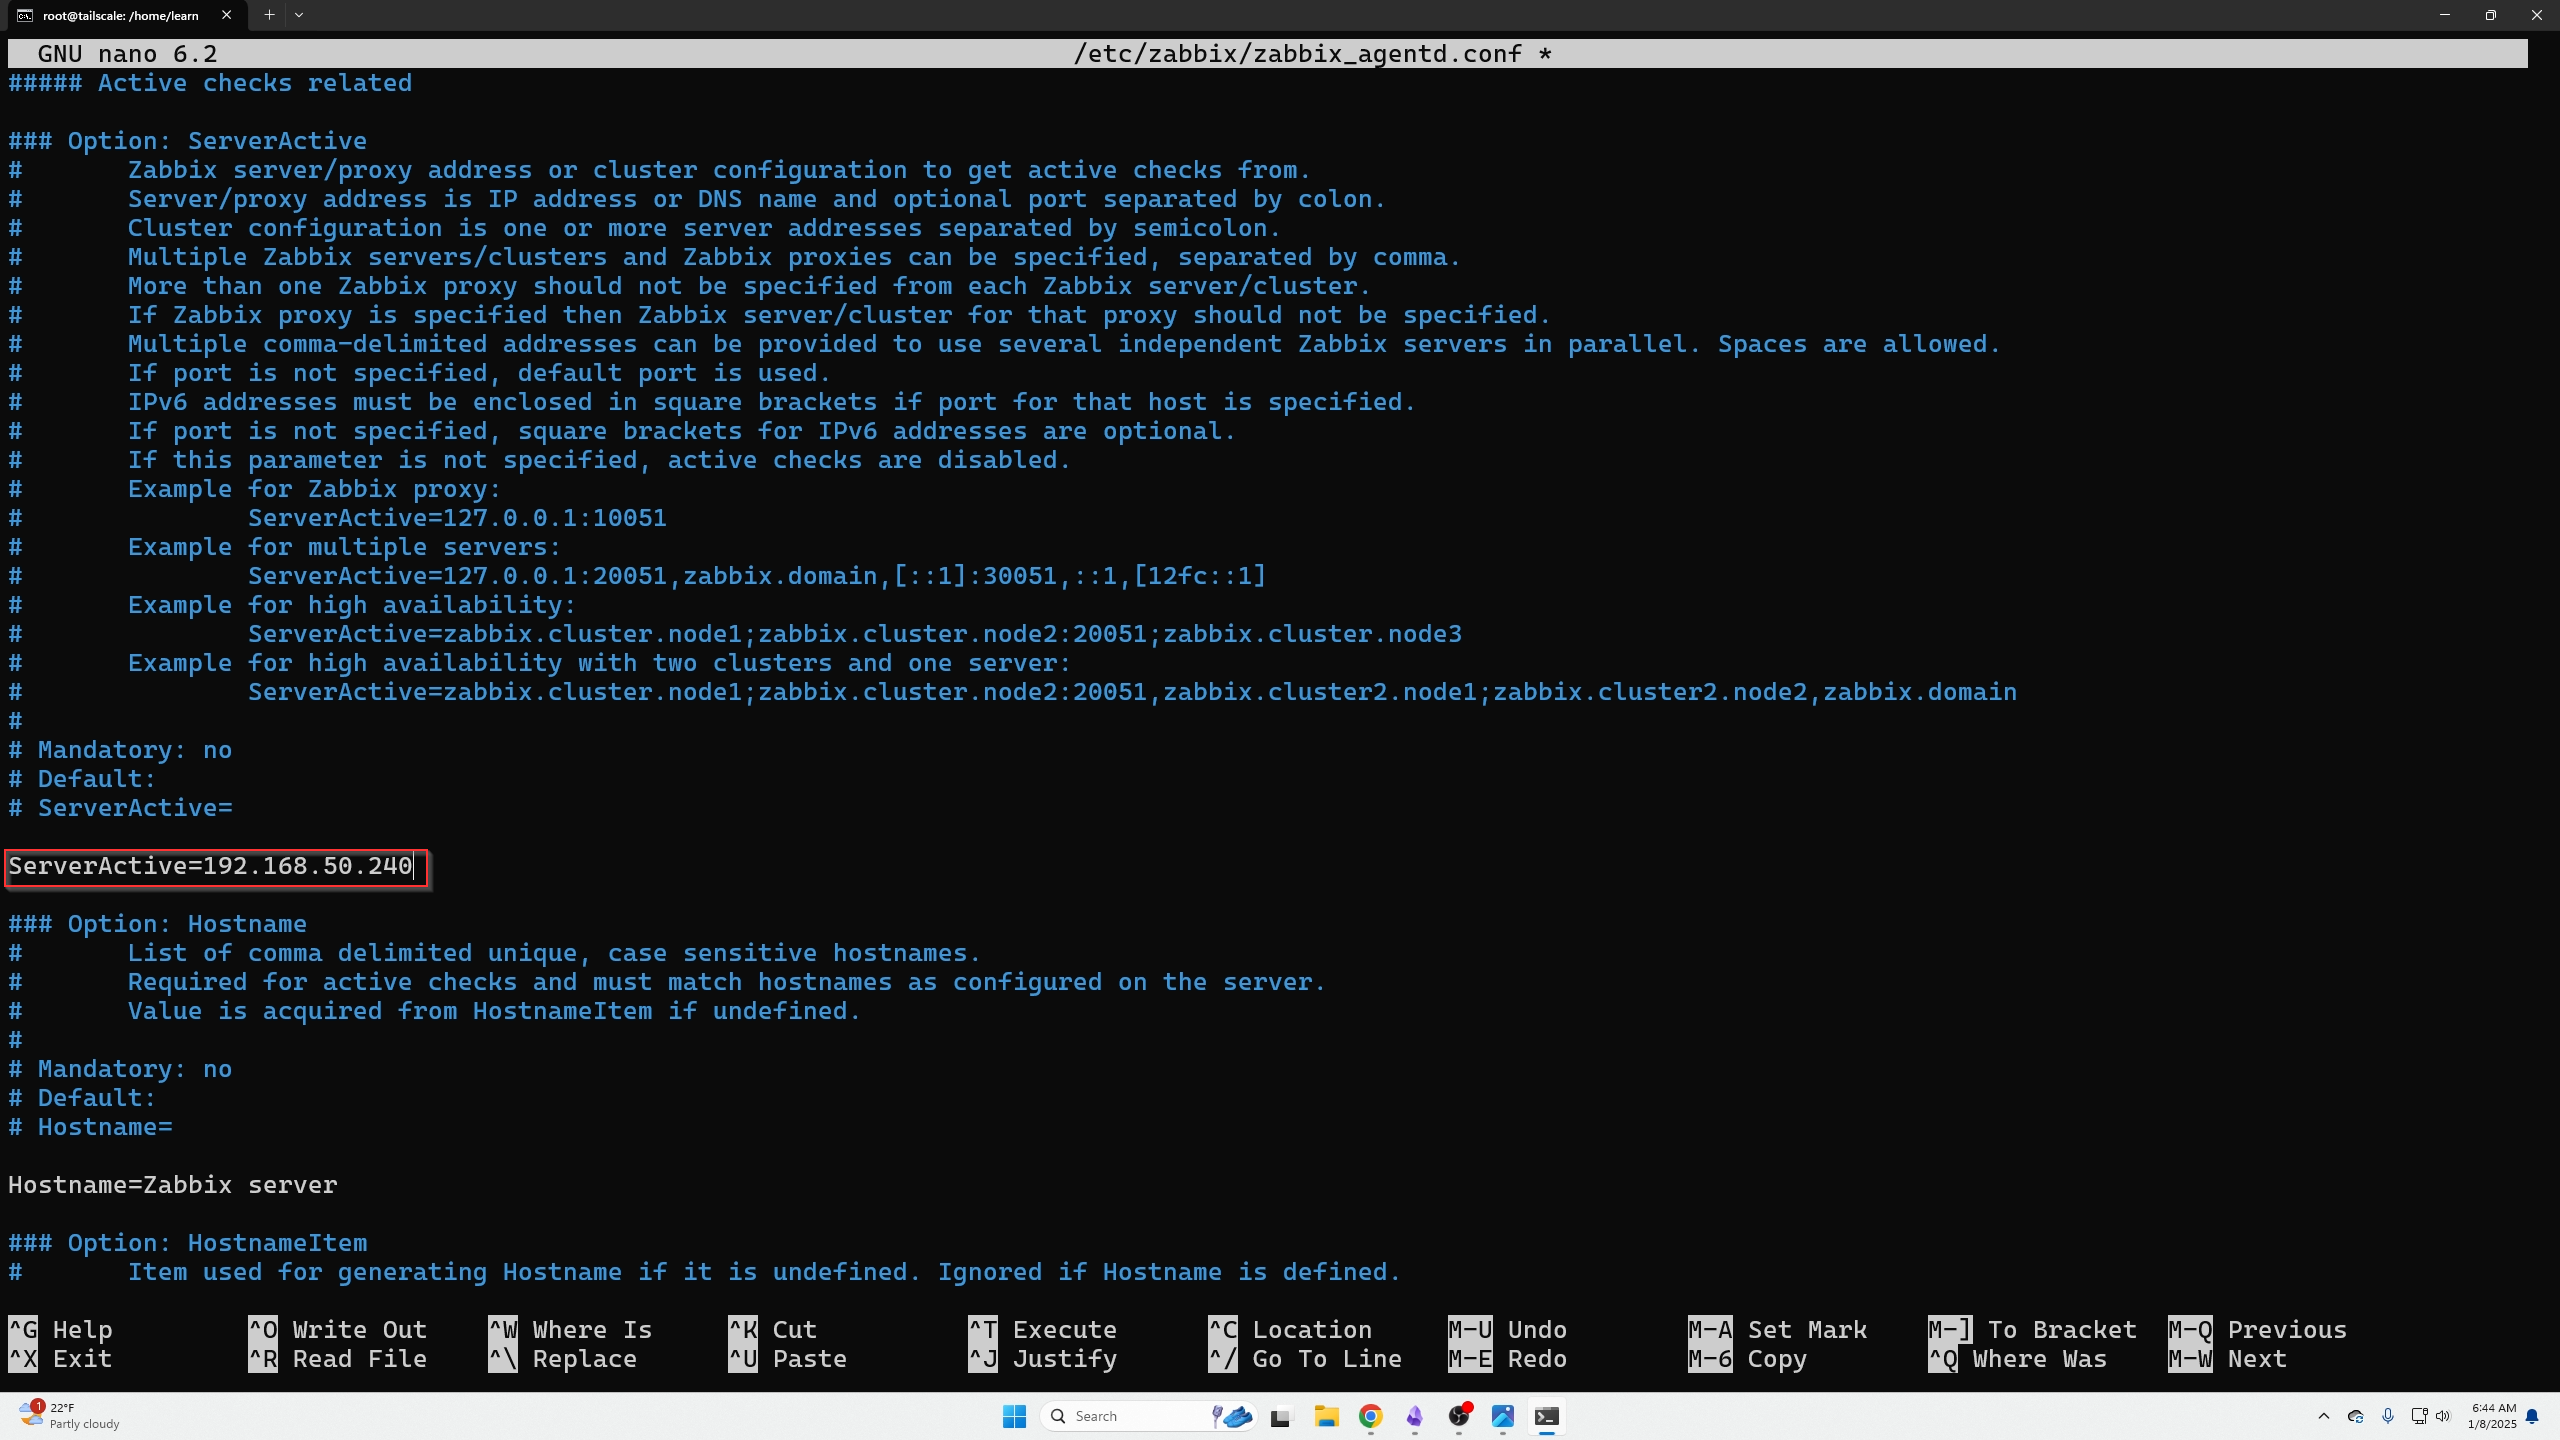
-
Change serveractive=(your server IP)
AND
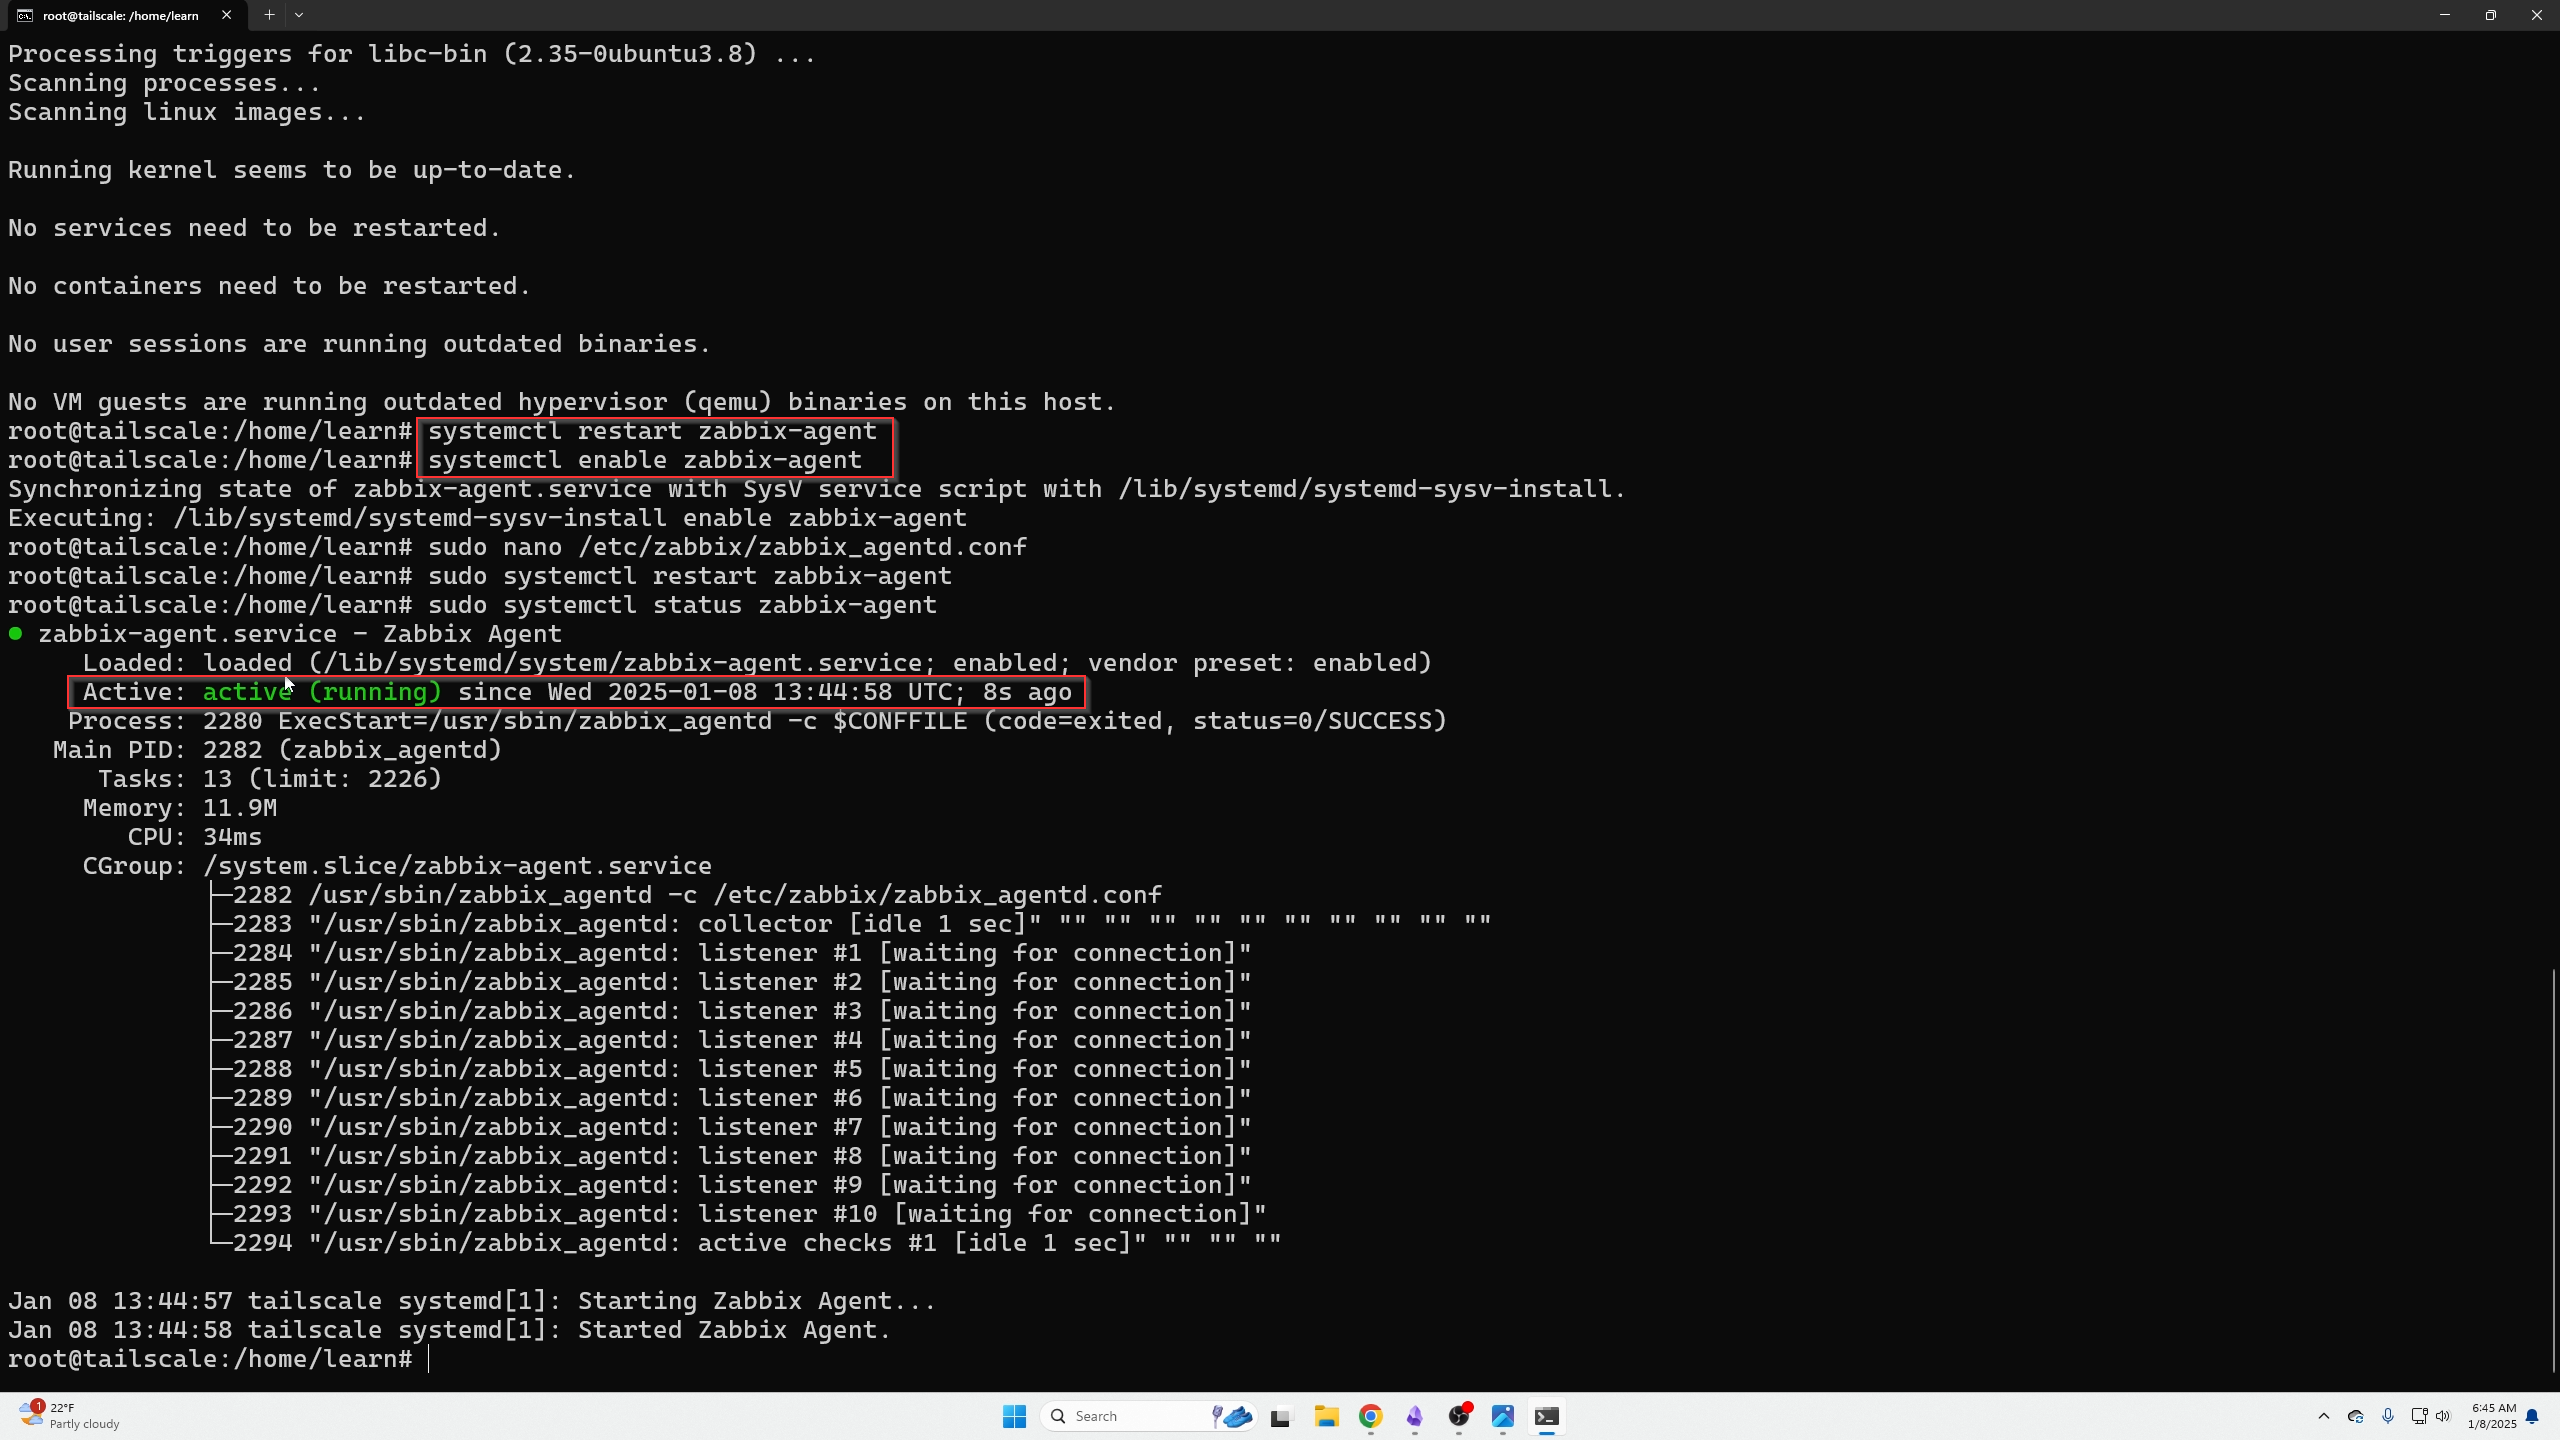
Check the Status of Your Zabbix Agent
Now you can verify your Agent is running with the following commands and will run after a VM reboot:
Verify the setting:
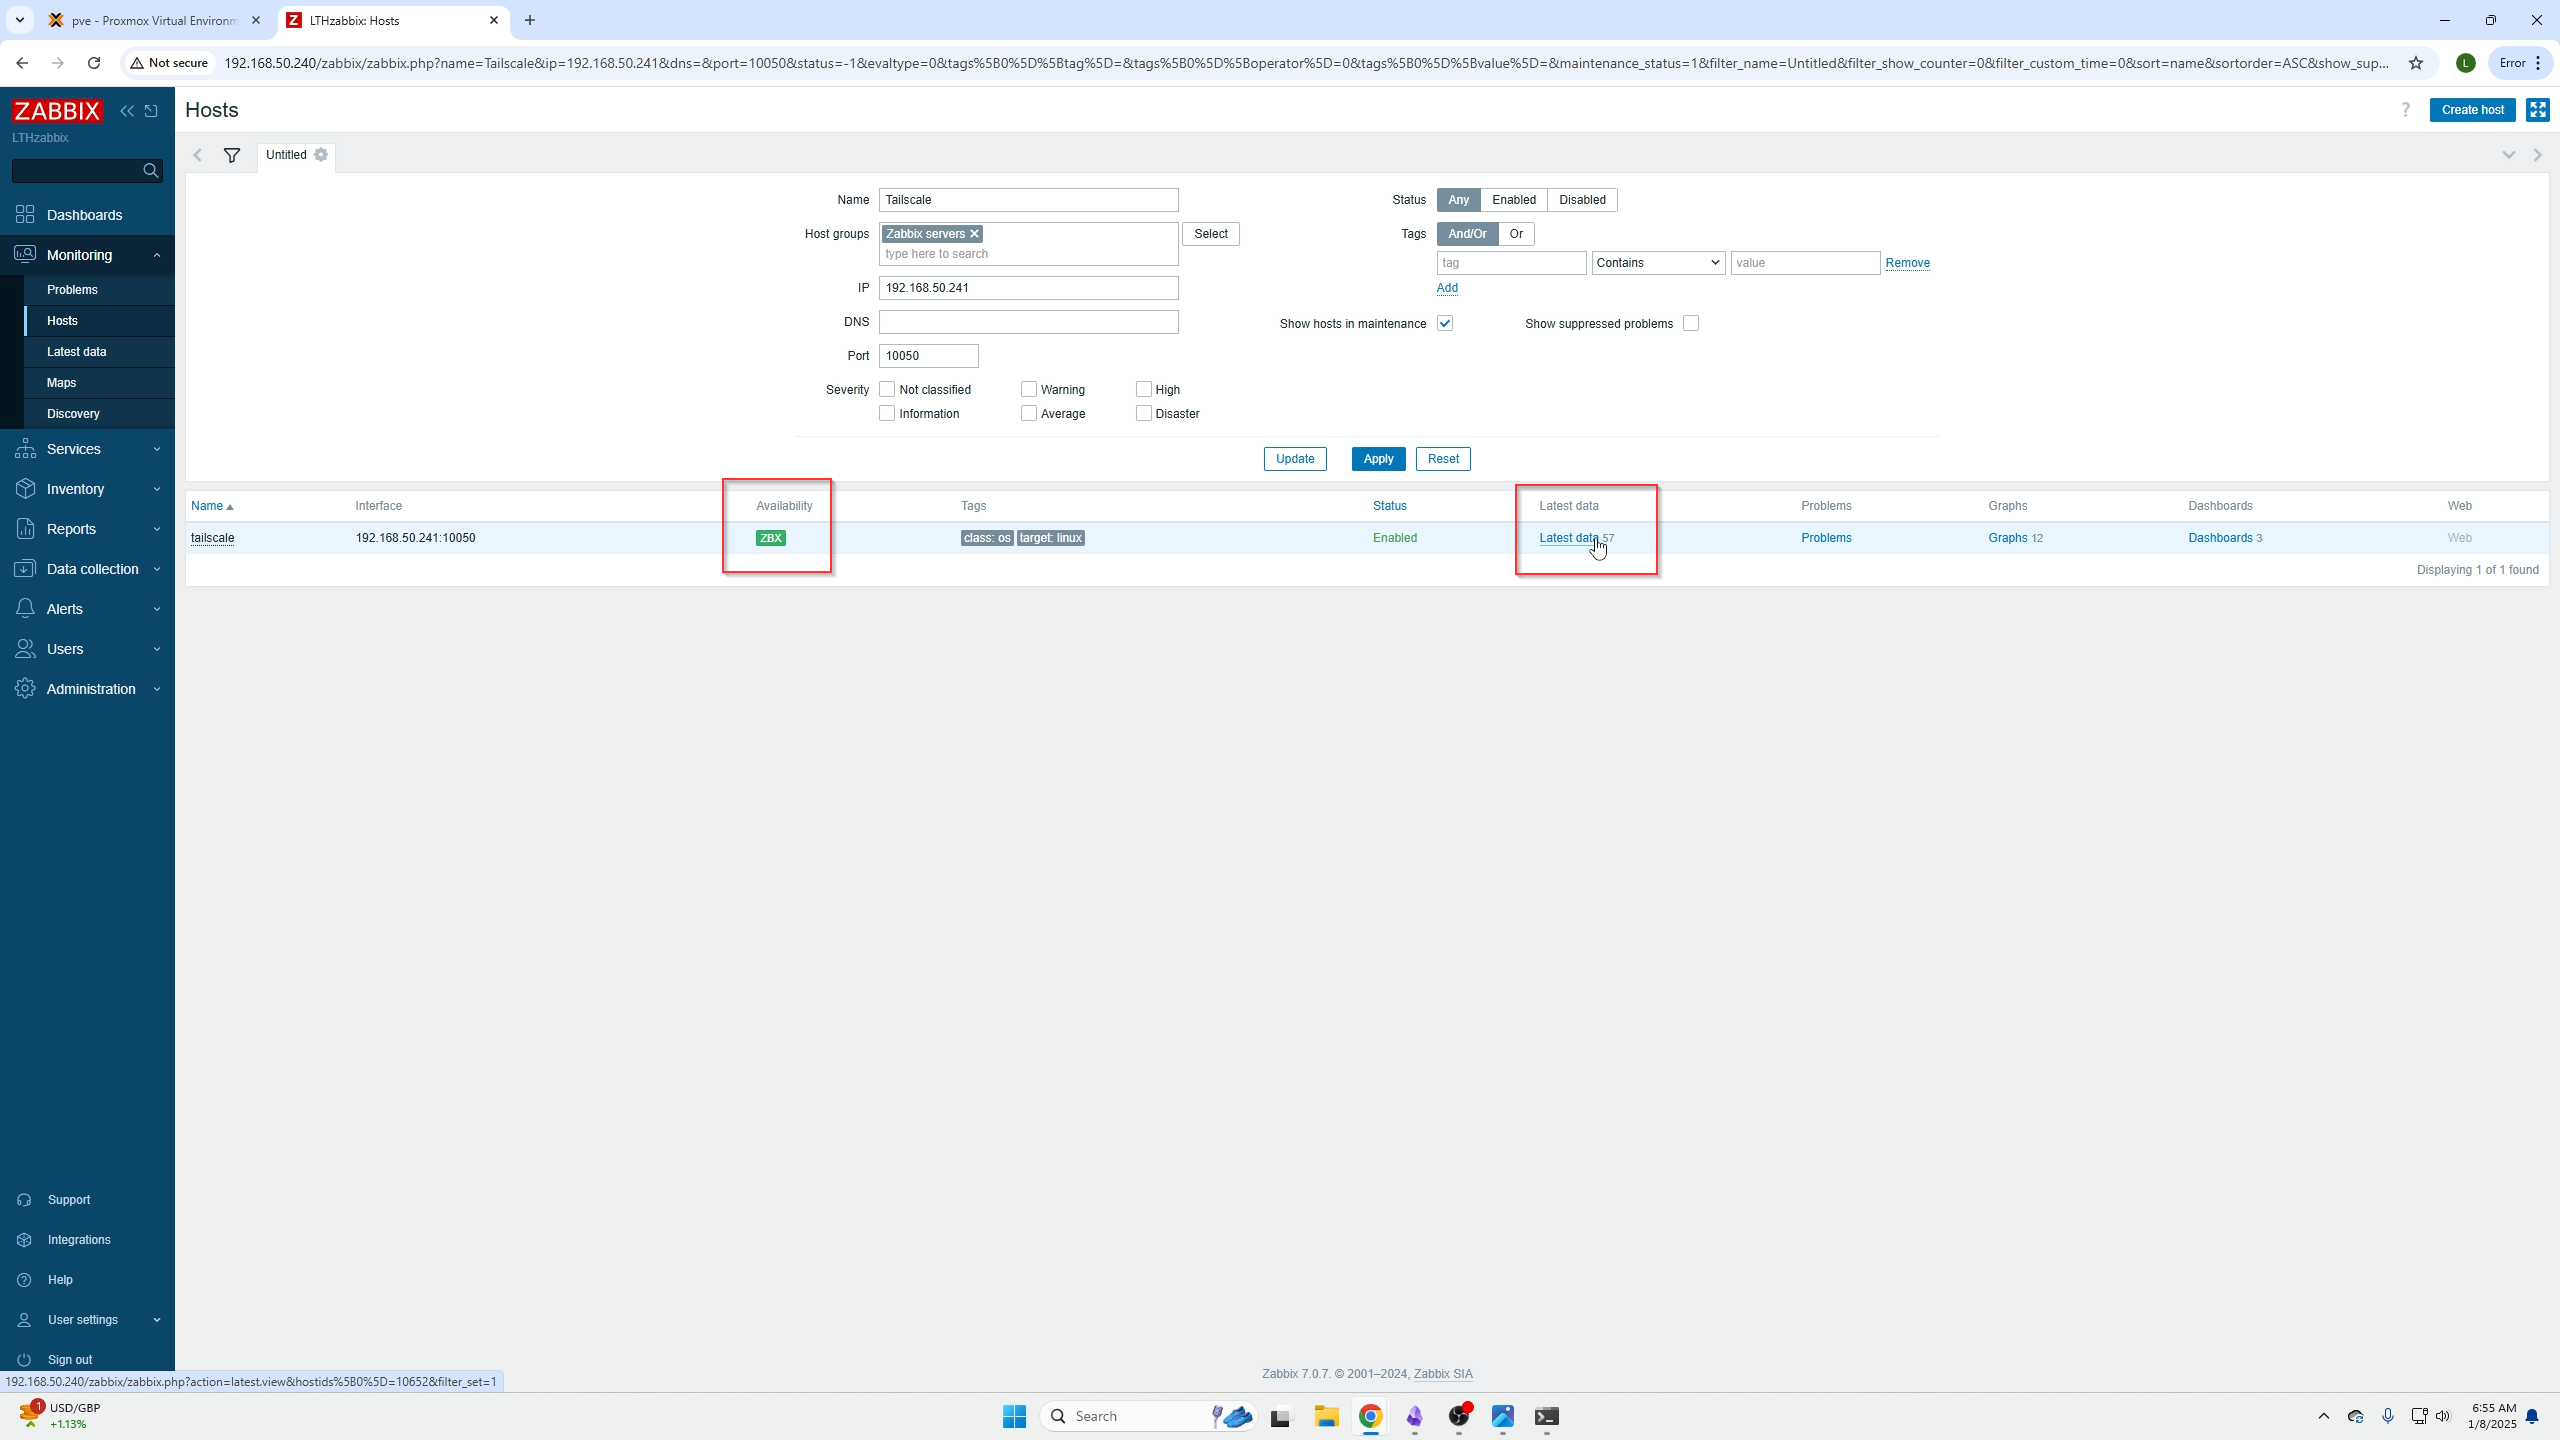
Adding an Agent to your Zabbix Server
Now we need to add an agent on the far right under Monitoring / Hosts.
On the far right you will see a blue create hosts button.
Give the device a hostname, grab the correct template in our case it is the Linux by Zabbix agent NOT the Agent Live one.
Then input the IP address of your VM/machine you just installed your Agent on and click add.

Now wait about 30 seconds to 5 minutes for the Availability ZBX sign to go green, and you will know its working. Red means its not, and gray is unknown (usually shown when you first add them).
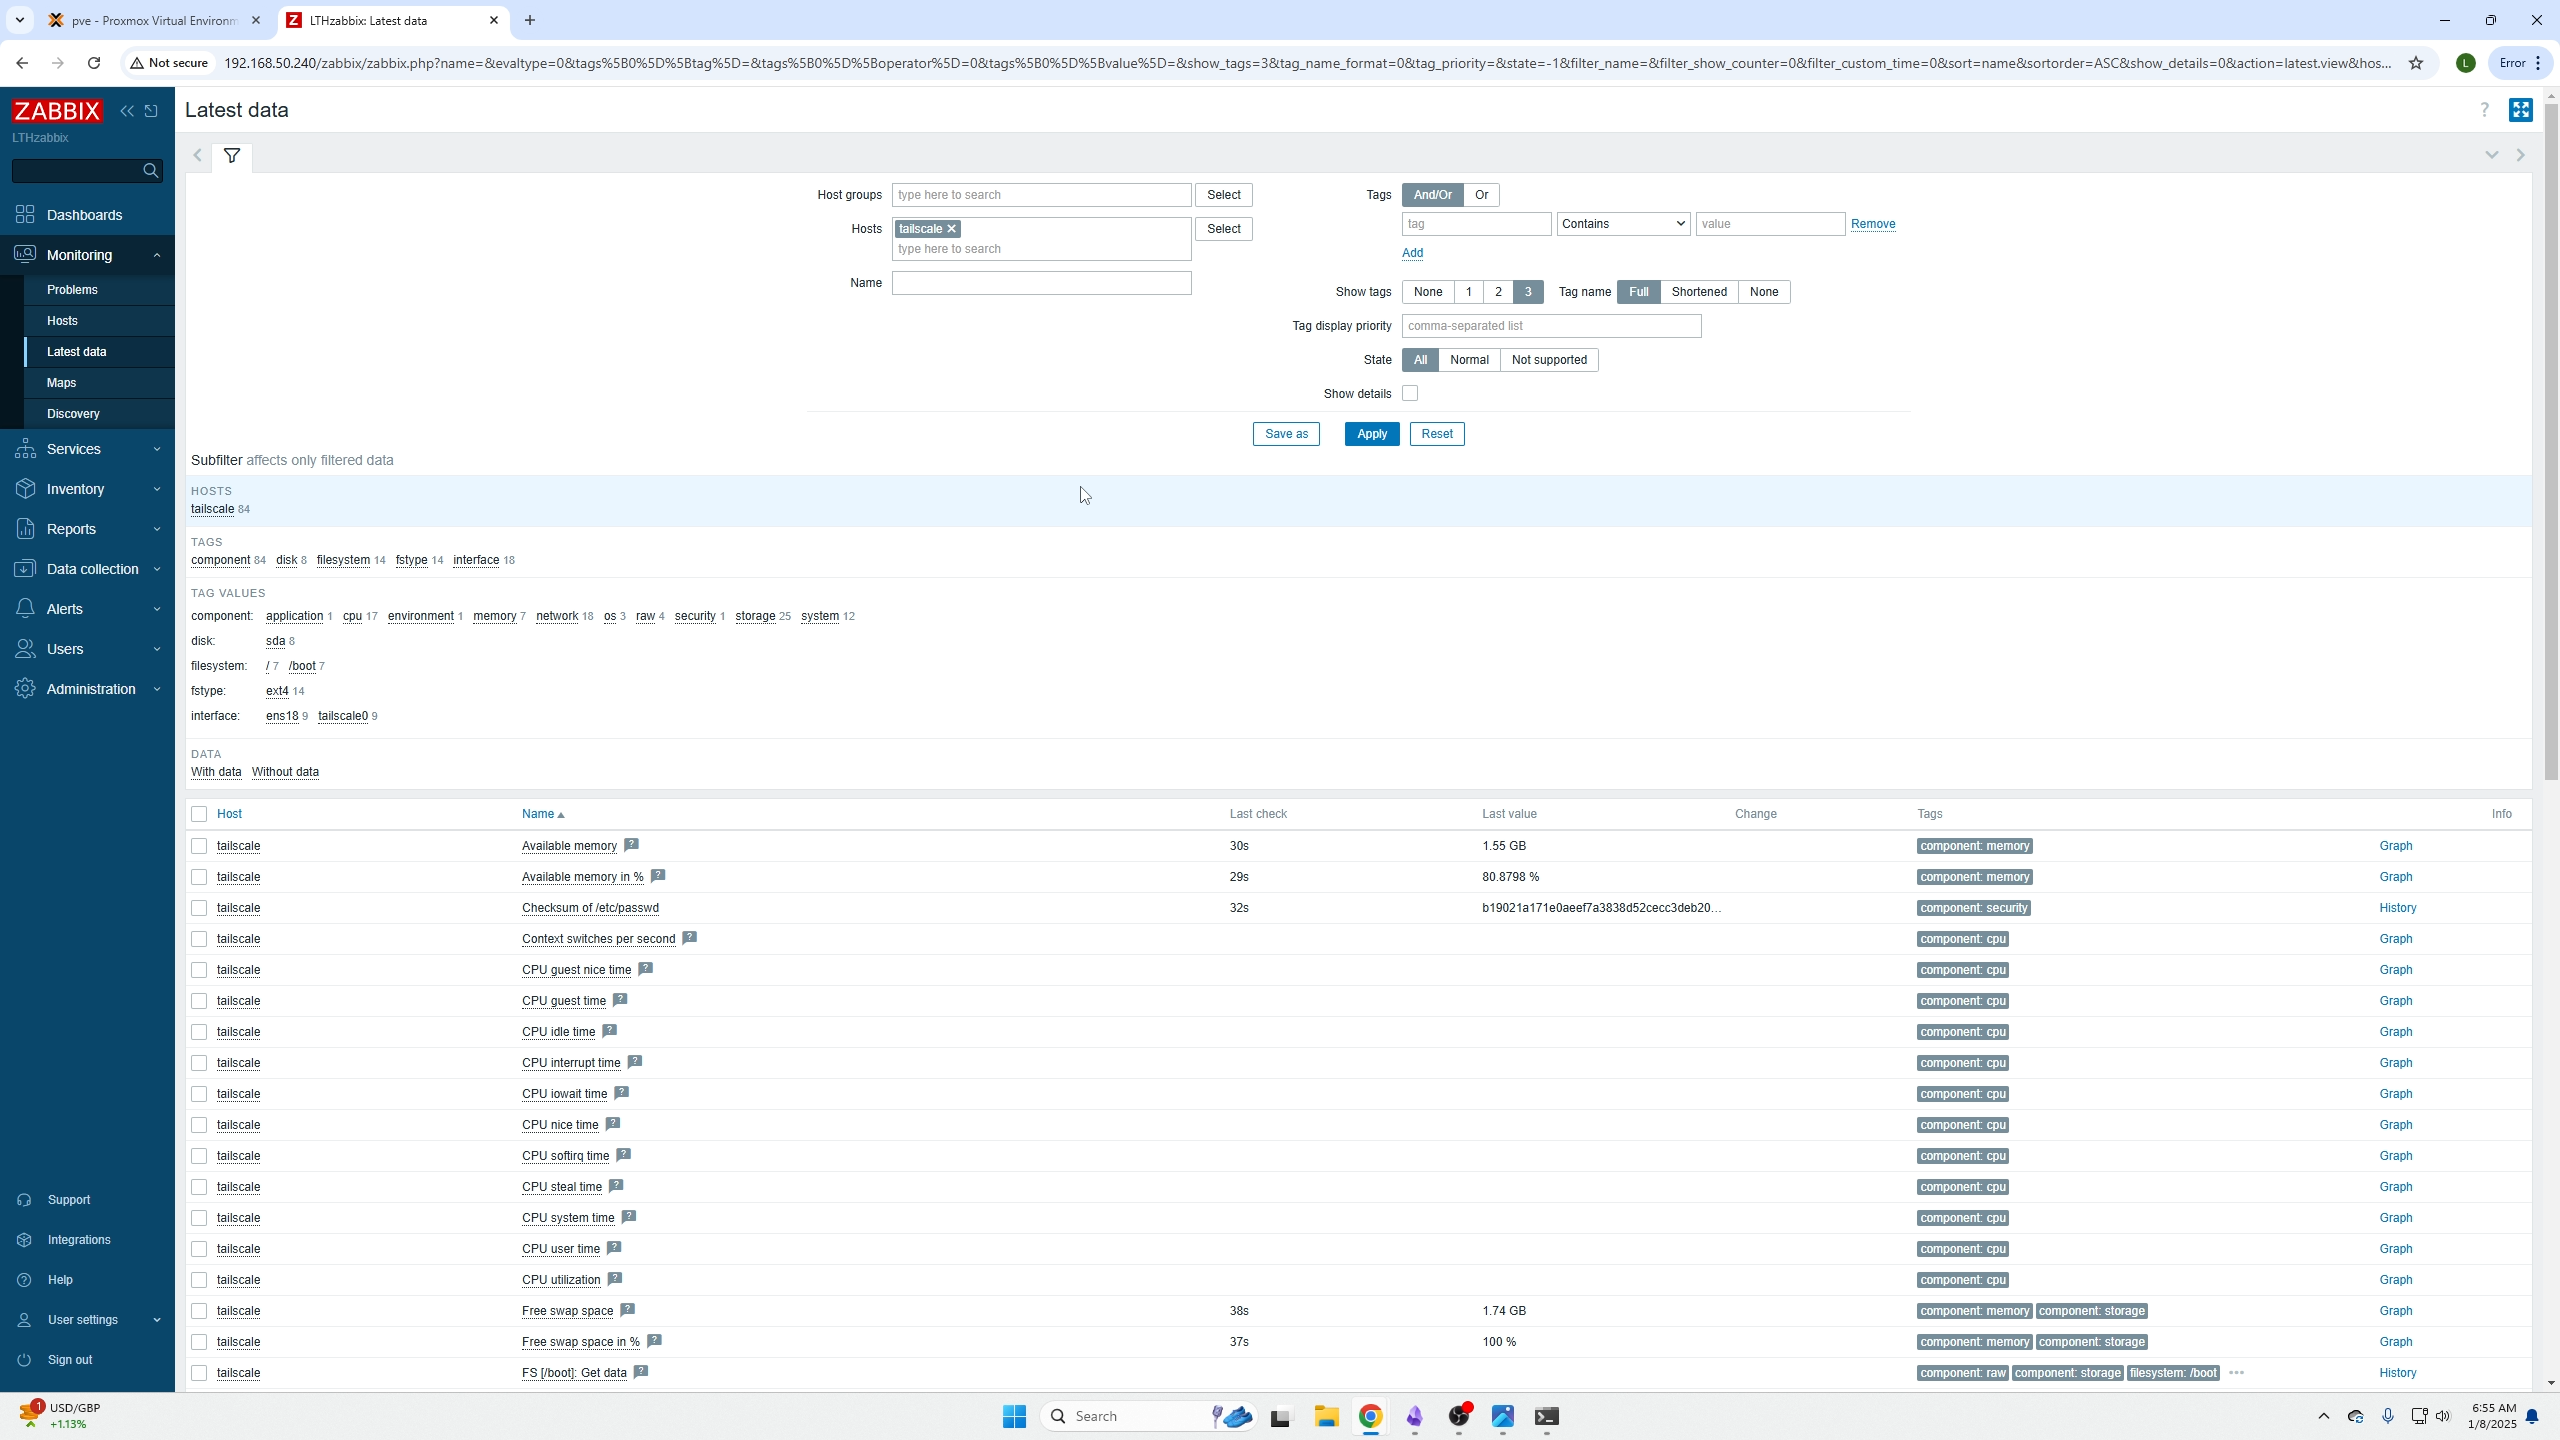
You can also click the Latest data tab to see what information it can gather or is gathering. This can take a couple hours to grab more specific data if the machine is even offering that type of data.
Picture showing data it is currently pulling:
Closing thoughts
That is it! Pretty simple right? Now in another episode we will cover how to add these hosts to data panels on your dashboard but Zabbix is so extensive I would reccomend you Google around yourself and find what you want and add them that way.